Skip to content

Projects

Detailed demos of my engineering, AI, IoT, robotics, and software projects.

Industry 5.0 & Robotics

REFUSE: 3D Demonstrator

DESPlant SimulationVR ImmersionManufacturing
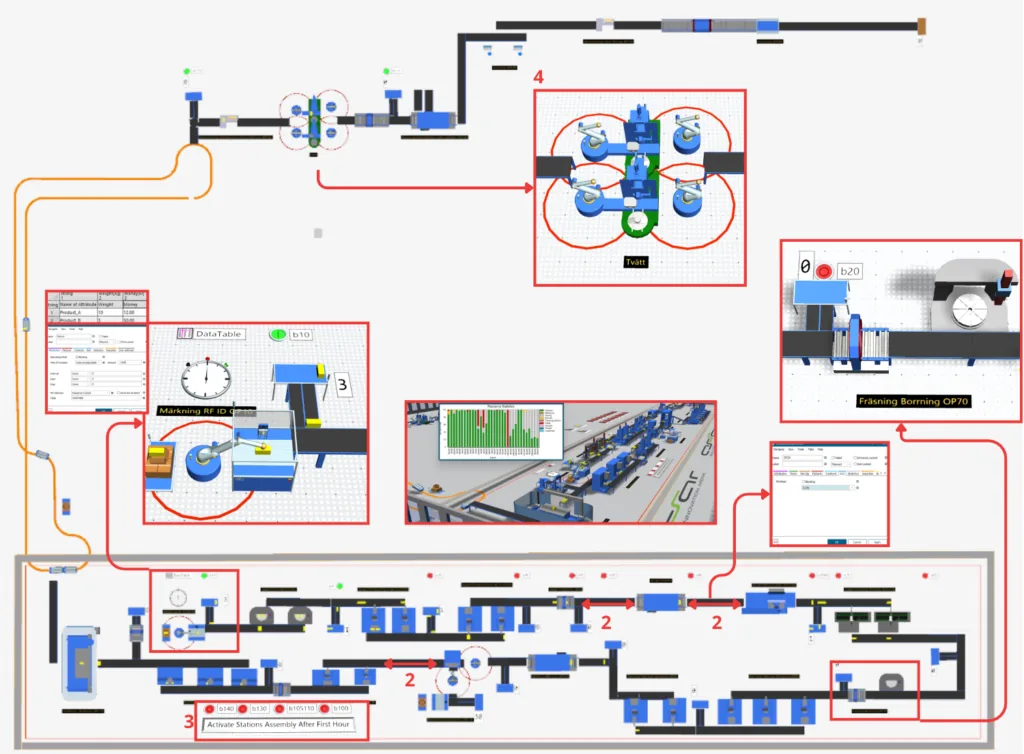
REFUSE 3D demonstrator: the Siemens Plant Simulation model of a reconfigurable factory at the ASSAR Industrial Innovation Arena, with annotated callouts on the RFID marking station, the washing cell, the milling and drilling operation and the assembly line feeding the VR walkthrough

A cutting-edge 3D demonstrator designed to bring reconfigurable manufacturing system concepts to life at the ASSAR Industrial Innovation Arena. Focused on bridging the gap between Plant Simulation models and immersive Virtual Reality environments, allowing stakeholders to virtually walk through a digitally reconfigurable factory. Industry partners: Scania, Volvo, AFRY, AC Floby, LEAX Group.

Plant Sim
Meta Quest
Unity

Surfing Simulator

INGENIUMDigital TwinsVR/AR

Developed a surfing simulator that integrates Virtual Reality (VR) with real-time Robotics to replicate the physical sensation of riding ocean waves. By leveraging the Unity 3D engine and Meta Quest headsets, the project creates an immersive visual environment driven by real-world data.

Unity 3D
Meta Quest
Surf Data
C#

X-RAPT: XR-Based Robot Programming Training

Usability TestingDigital TwinsVR/ARSoftware Architecture
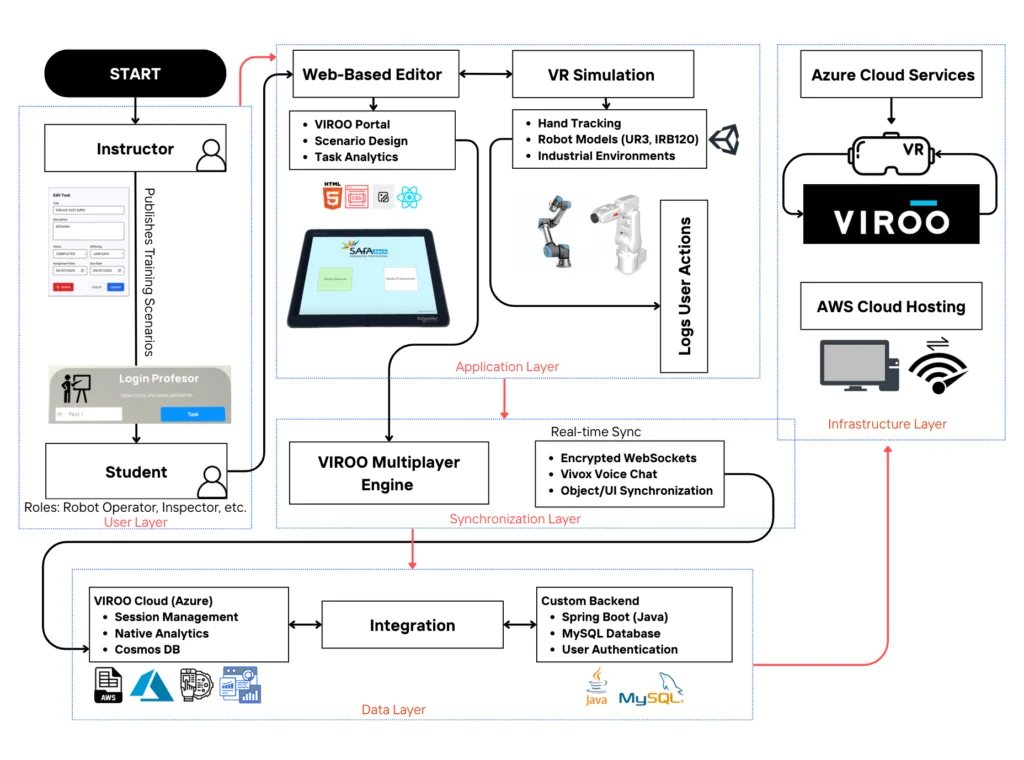
X-RAPT five-layer architecture: instructors and students in the user layer, a web editor and VR simulation of UR3 and ABB IRB120 robots in the application layer, the VIROO multiplayer engine handling real-time sync, and a Java Spring Boot backend on AWS and Azure in the data and infrastructure layers

In collaboration with the University of Skövde, I participated in the development and evaluation of X-RAPT, a multi-user XR platform designed to bridge the gap between virtual simulation and industrial robot programming. This project leverages a 5-layer architecture integrating Unity-based Digital Twins of UR3 and ABB IRB120 robots with a Java Spring Boot and AWS backend. My role focused on investigating the technical feasibility of cross-platform VR/PC synchronization and conducting usability testing.

Unity
Meta Quest
C#
ABB
Spring Boot
AWS

Embedded & IoT

Resilient Intelligent Safety System for Industrial Lockout-Tagout

Cyber-Physical ArchitectureAdvanced LoggingRESTful Backend
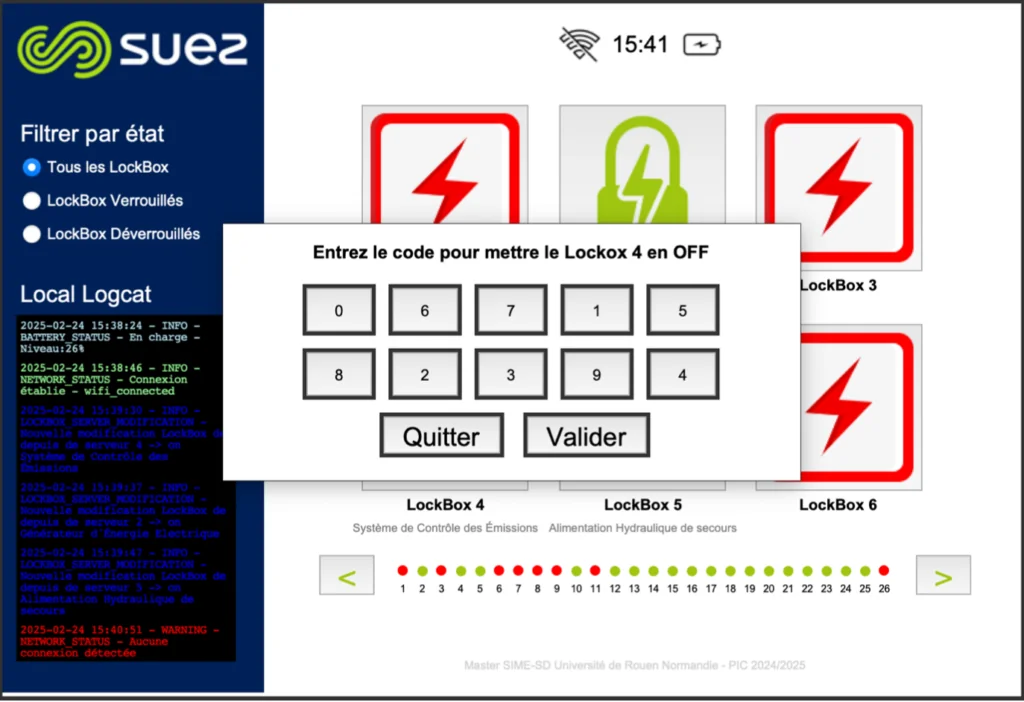
Lockout-tagout station touchscreen in local mode: the 26 electronic lockboxes shown locked or unlocked, a keypad prompting for the release code, and a live local log recording battery, network and server events

Developed an intelligent, connected lockout-tagout (LOTO) station designed to manage 26 electronic locks for industrial safety. The system ensures that maintenance operations are performed securely by controlling access to equipment through a centralized digital interface. Built on a Raspberry Pi 4/5 architecture and engineered for extreme resilience: in the event of a network failure, the station automatically switches to a Local Mode, utilizing a local CSV-based database and a Tkinter-based HMI to ensure safety protocols are never interrupted.

Raspberry Pi
Flask
Tkinter HMI
IoT / GPIO
Network / GSM

Deep Learning Model Compression via TFLite Quantization

Post-Training QuantizationModel ArchitectureOptimization Strategies
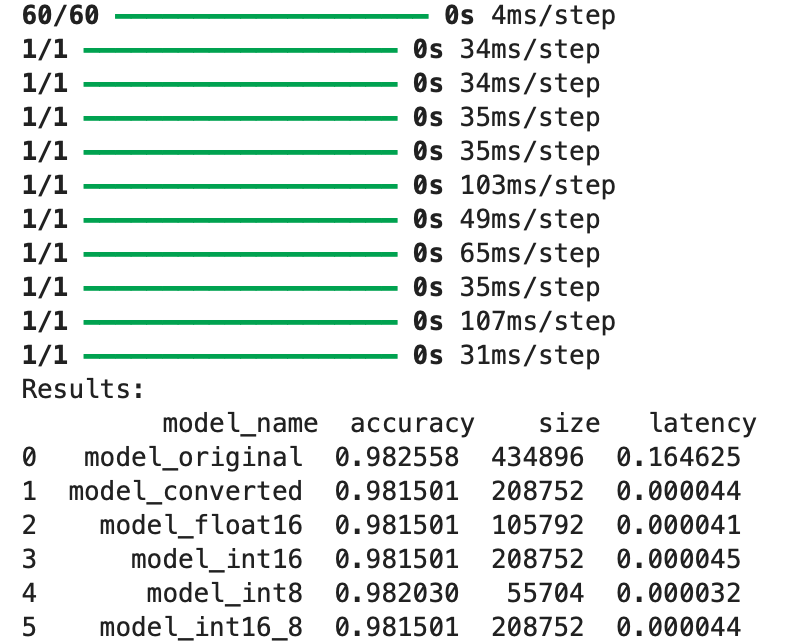
TensorFlow Lite quantization benchmark: the original model against float16, int16 and int8 variants, showing accuracy holding near 0.98 while size drops from 434 KB to 55 KB and latency falls by three orders of magnitude

Developed as part of the Specialized Architectures module at the University of Rouen Normandy, this project focuses on the end-to-end pipeline of creating, training, and optimizing a neural network for embedded deployment. It addresses the challenge of deploying a 1024-feature classification model onto resource-constrained devices. By implementing Post-Training Quantization (PTQ) using TensorFlow Lite, the model weights and activations are compressed from 32-bit floating points to 8-bit integers.
Post-training INT8 quantization
1conv = tf.lite.TFLiteConverter.from_keras_model(model)
2conv.optimizations = [tf.lite.Optimize.DEFAULT]
3conv.target_spec.supported_types = [tf.int8]
4tflite_model = conv.convert() # 32-bit → 8-bit
Python
TensorFlow
TF Lite
Scikit-Learn
Keras

Web & Mobile

Real-Time Interactive Presentation & Engagement Analytics Platform

Live Audience ReactionsPolls & QuestionsLive DrawingEngagement Analytics
Diaposi presenter view: a live slide surrounded by the drawing toolbar and the questions, polls, history and reactions panels the audience feeds in real time

Diaposi turns any slide deck into a two-way, real-time conversation. Reactions, questions, polls and live drawing let you see exactly what your audience understands, so every presentation is audience-centric, not one-directional.

React
Vite
TypeScript
Node.js
MongoDB
Socket.io
SEO
Startup

Mobile Data Management App

AndroidJetpack ComposeRoomRetrofit
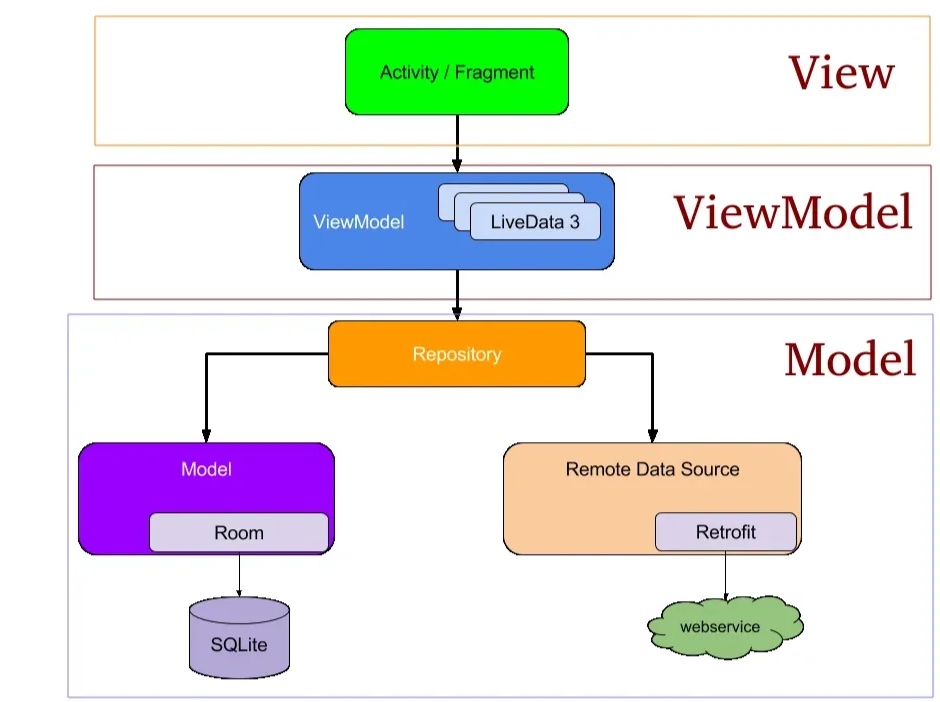
MVVM architecture of the Android app: Activity and Fragment in the view layer, a ViewModel exposing LiveData, and a repository fanning out to Room over SQLite for local storage and Retrofit for the remote web service
A native Android application designed to manage and visualize mobile data efficiently. Built with Jetpack Compose, it integrates local storage and remote data fetching to offer a seamless user experience.

Compose + Retrofit data flow
1@Composable
2fun DataScreen(vm: DataViewModel = hiltViewModel()) {
3 val items by vm.items.collectAsState()
4 LazyColumn { items(items) { ItemRow(it) } }
5}
Kotlin
Jetpack Compose
Hilt
Coroutines
Retrofit

AI, ML & Computer Vision

Stochastic Path Planning with Markov Decision Processes

Artificial IntelligenceReinforcement LearningMarkov Decision Process
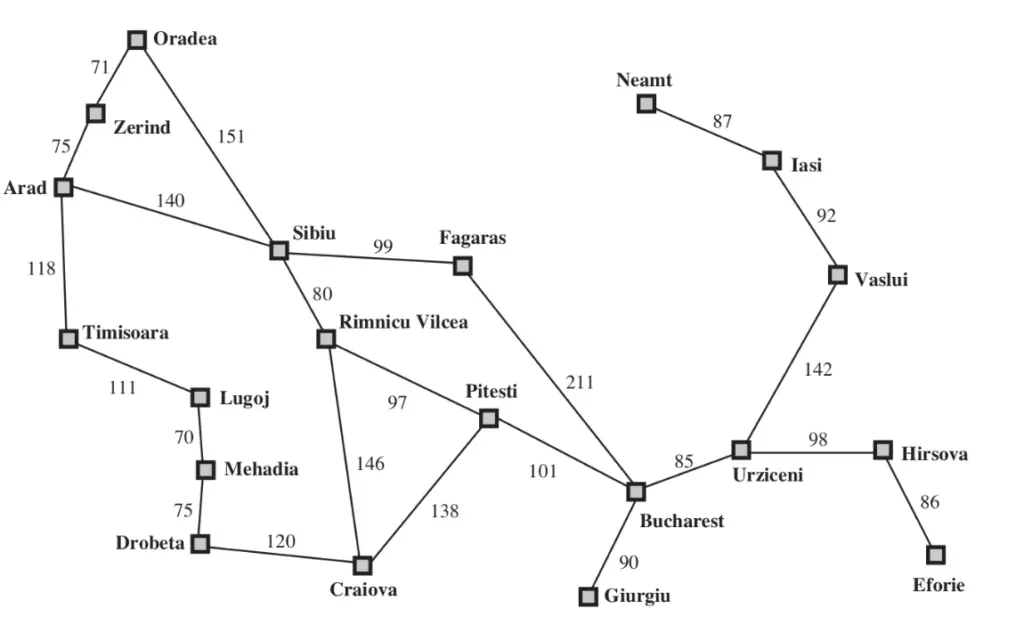
Romanian city map used as the MDP state space for stochastic path planning, with road distances linking Arad, Sibiu, Pitesti and Bucharest
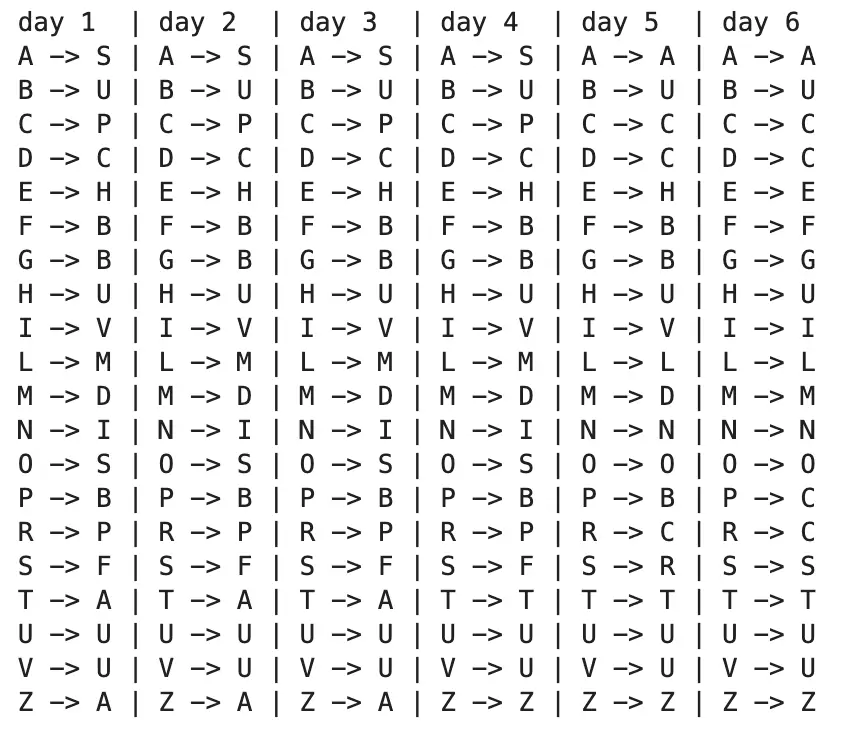
Optimal time-dependent MDP policy computed by backward dynamic programming: the best next city to travel to from each city on each of the six remaining days

This project models a stochastic path-planning problem using a finite-horizon Markov Decision Process. An agent must reach a target city within a limited number of days while accounting for uncertain action outcomes. The optimal time-dependent policy is computed using backward dynamic programming.

Python
MDP

Real-Time Billiard Ball Tracking & Analytics

Object DetectionBall TrackingSports AnalyticsComputer Vision
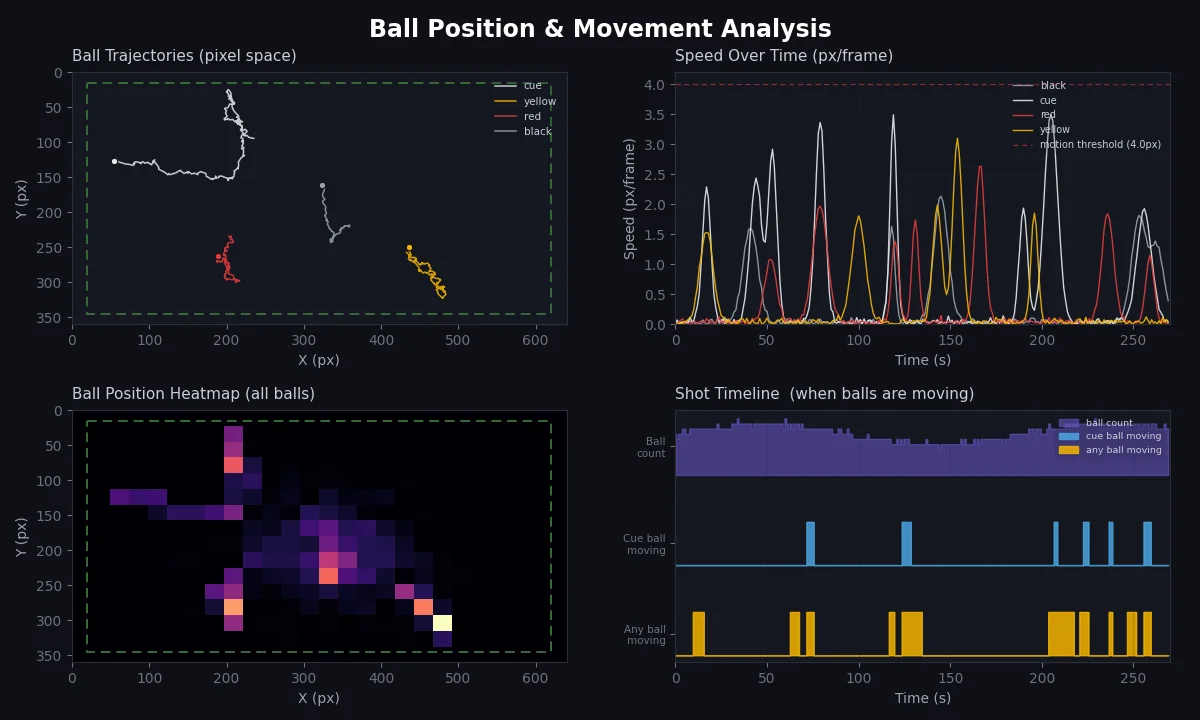
Billiard computer vision analytics dashboard: per-ball trajectories in pixel space, speed-over-time profiles, a ball position heatmap and a shot timeline
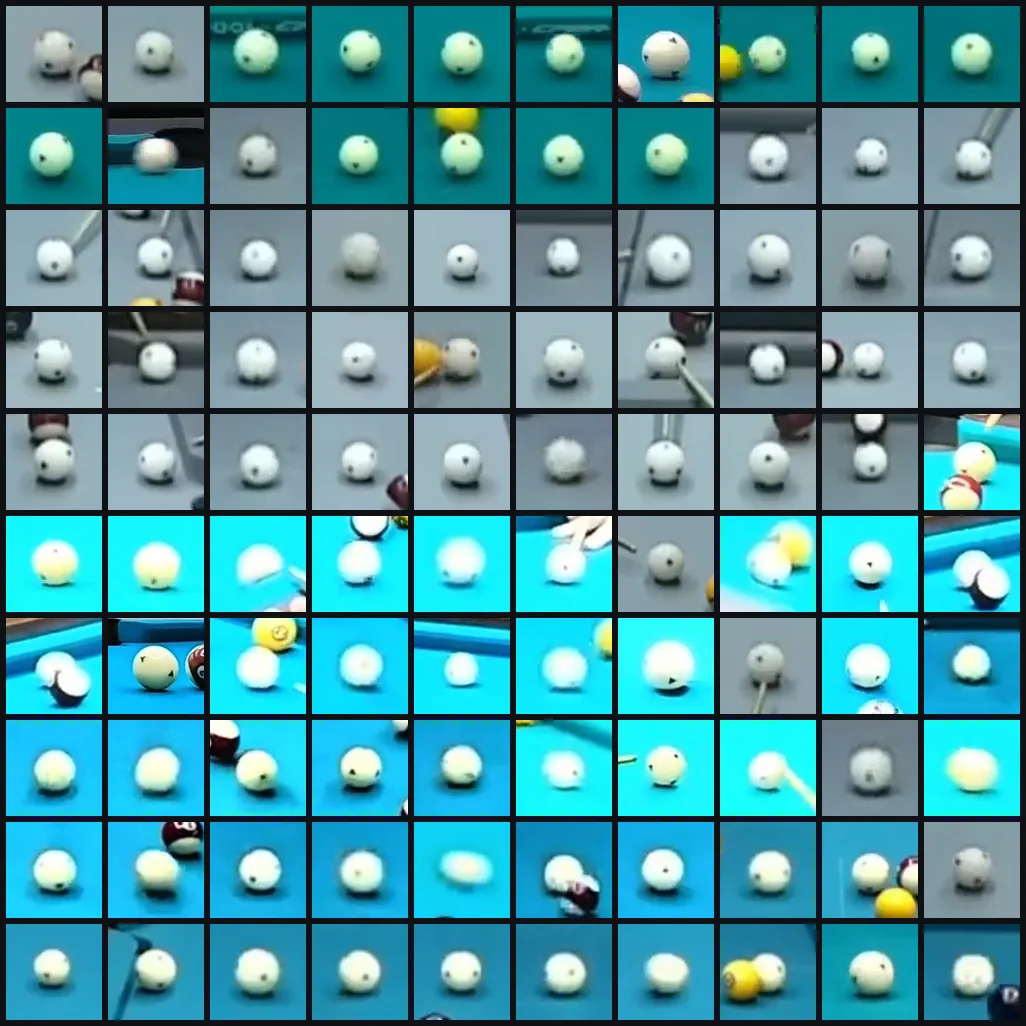
Contact sheet of cue ball crops detected frame by frame by the custom-trained YOLOv8 model across the match
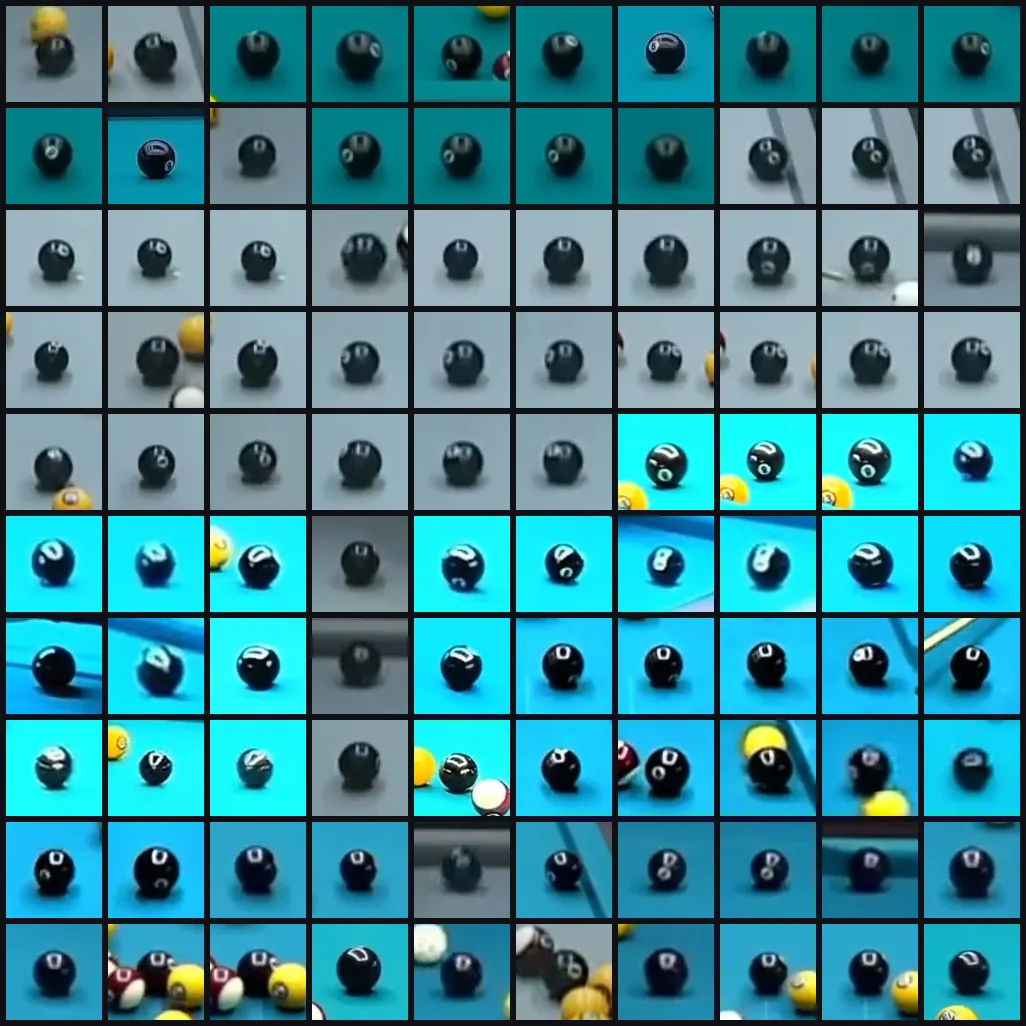
Contact sheet of black 8-ball detections tracked through the match by the YOLOv8 computer vision pipeline

Computer vision system that detects and tracks billiard balls in real-time match footage using a custom-trained YOLOv8 model. Trained on a hand-labeled dataset of cue, yellow, red and black (8-ball) instances, it produces per-ball trajectories, speed profiles, heatmaps, and a shot timeline, all rendered in an analytics dashboard.

Python
YOLOv8
OpenCV
PyTorch

YAMS Reinforcement Learning Agent

Reinforcement LearningGame TheoryStochastic Modeling
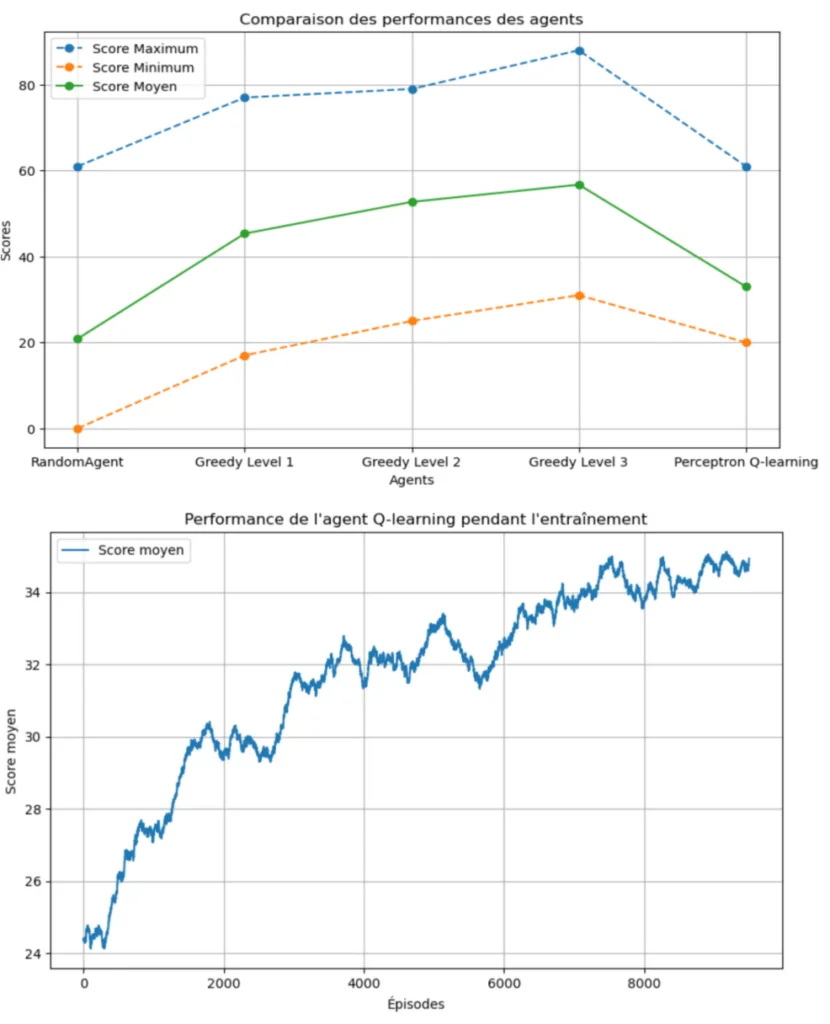
Yahtzee agent scores compared across a random agent, three greedy levels and Perceptron Q-learning, above the Q-learning average-score curve rising over 10,000 training episodes
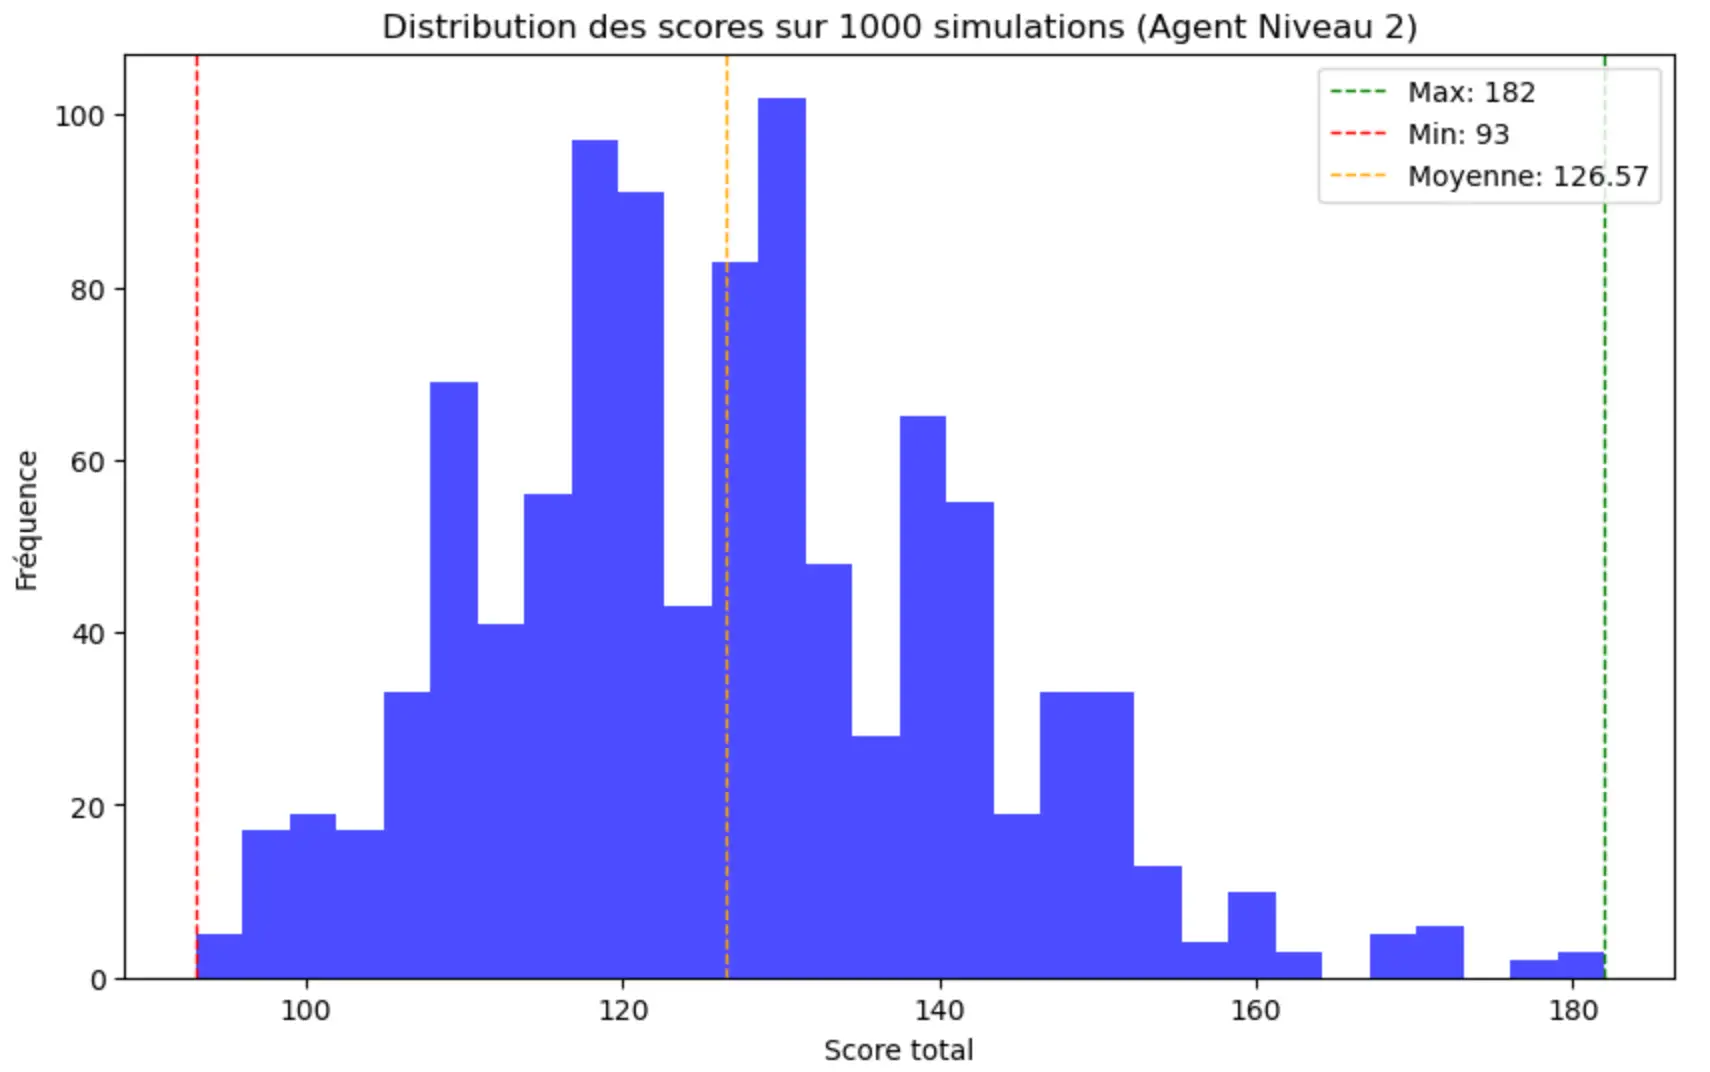
Score distribution of the level 2 Yahtzee agent over 1,000 simulated games: mean 126.6, ranging from 93 to 182
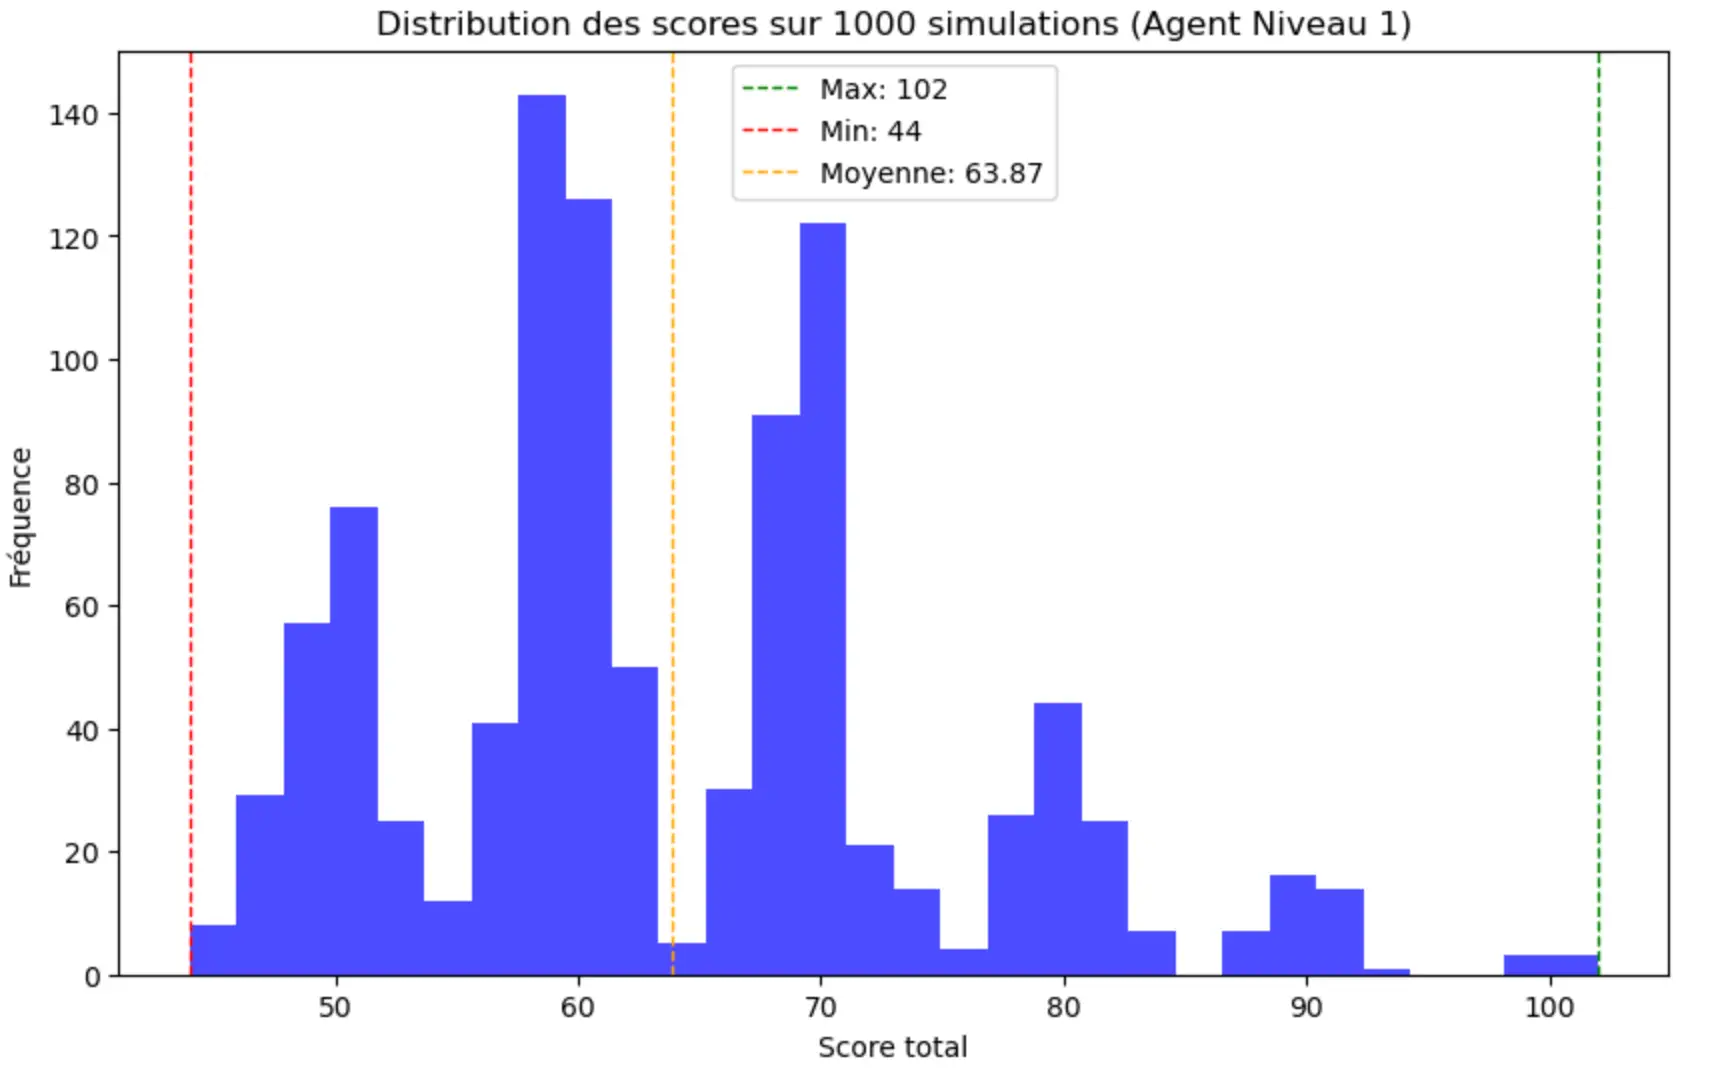
Score distribution of the level 1 Yahtzee agent over 1,000 simulated games: mean 63.9, ranging from 44 to 102
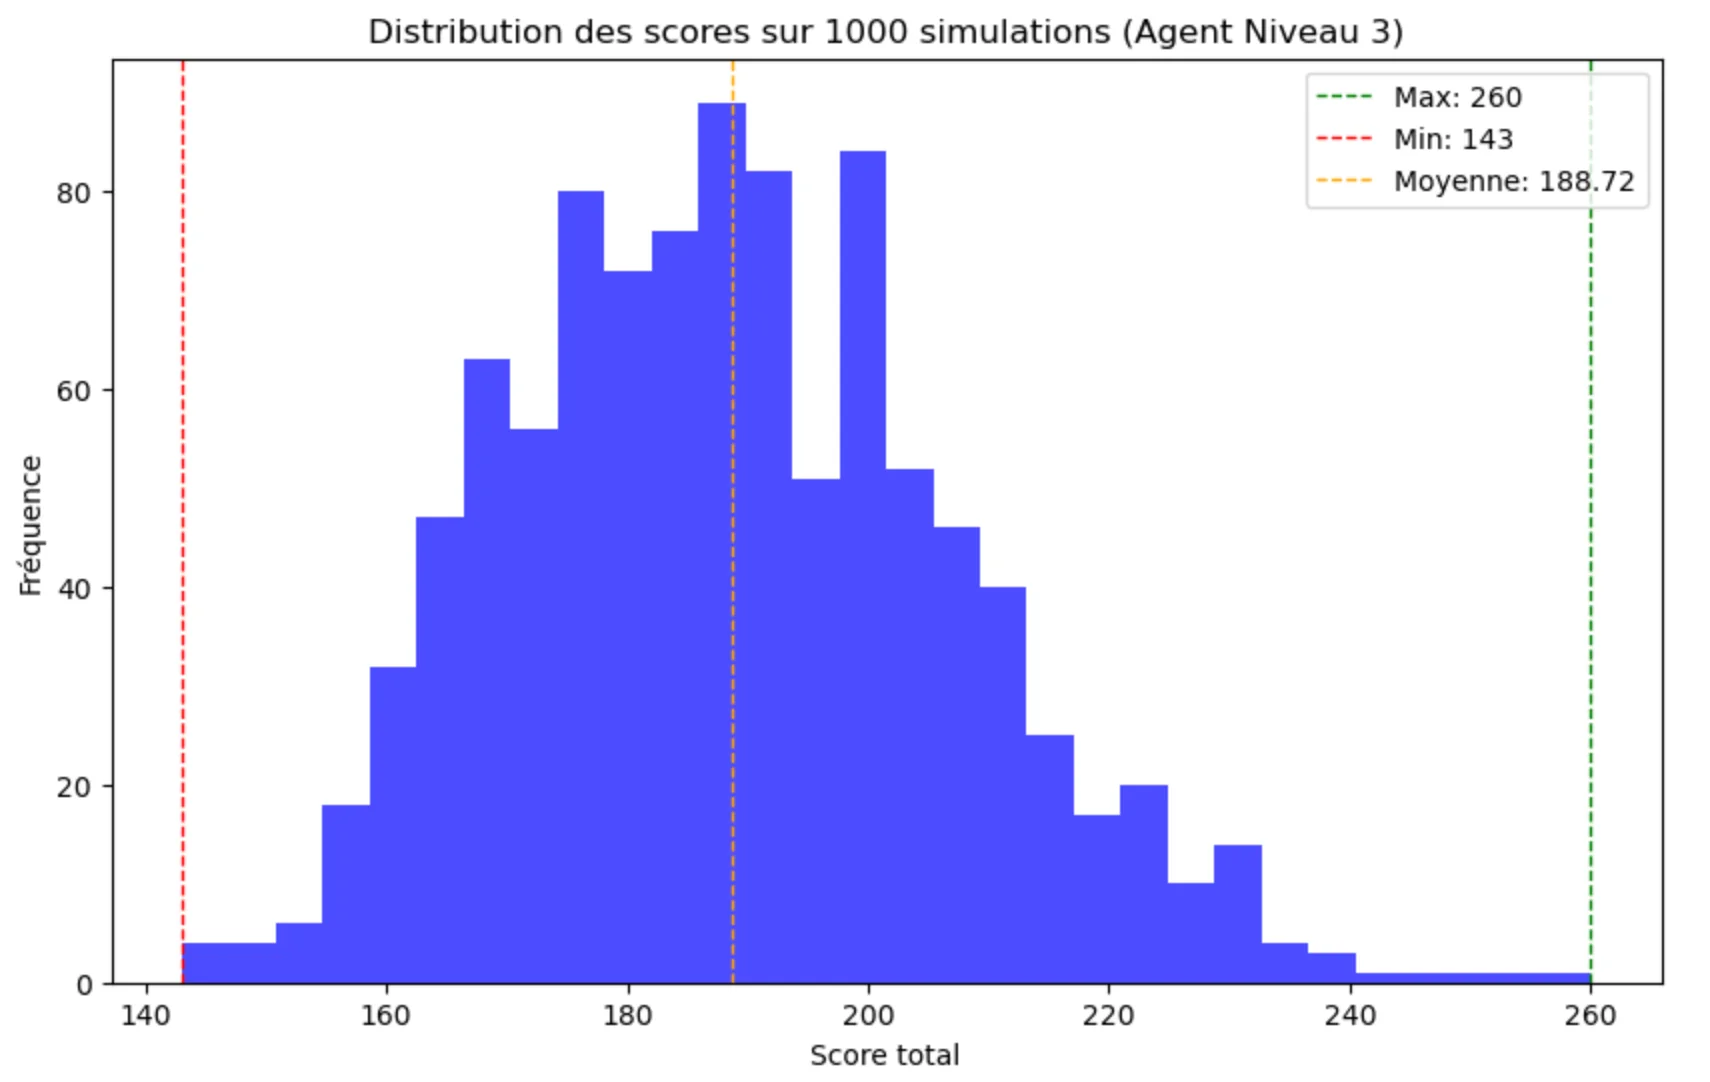
Score distribution of the level 3 Yahtzee agent over 1,000 simulated games: mean 188.7, ranging from 143 to 260

Developed an autonomous AI agent trained to play Yahtzee (YAMS) optimally. The project compares multiple RL strategies, including SARSA, Q-Learning, and Perceptron-based Function Approximation, to navigate a state space of over 1,200 possibilities and maximize long-term scoring across multi-turn episodes.

Core Q-Learning update
1def update_q(self, s, a, r, s_next, alpha, gamma):
2 best_next = np.argmax(self.q[s_next])
3 td_target = r + gamma * self.q[s_next][best_next]
4 td_error = td_target - self.q[s][a]
5 self.q[s][a] += alpha * td_error
Python
NumPy
Scikit-Learn
Stochastic

Plant Disease Recognition & XAI

Computer VisionDeep LearningExplainable AI
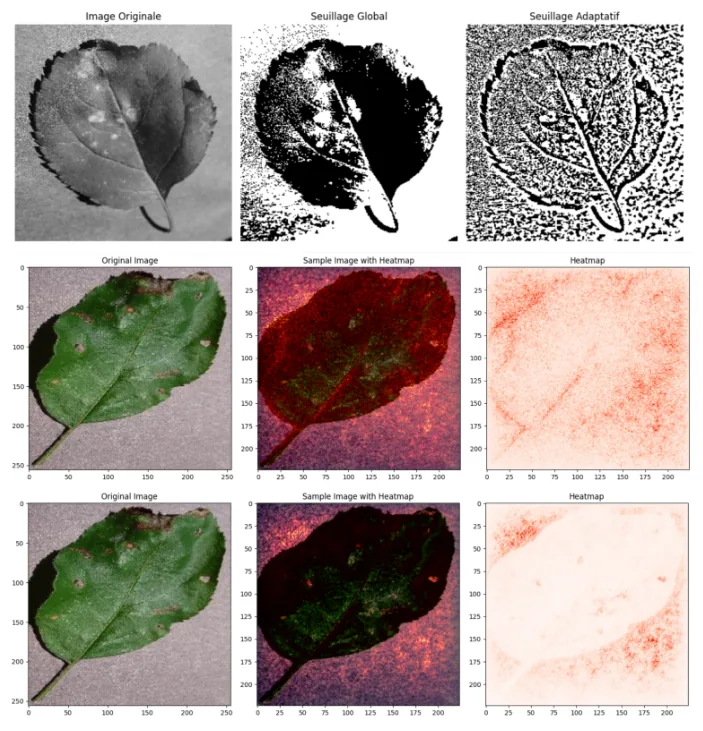
Apple Black Rot detection pipeline: a diseased apple leaf under global and adaptive thresholding, then sensitivity-analysis heatmaps highlighting the pixels the VGG-16 model relies on to reach its diagnosis

Implemented a diagnostic pipeline to identify Apple Black Rot using VGG-16 deep feature extraction. The project compares Fisher Discriminant Analysis against Difference-of-Means and utilizes Sensitivity Analysis to generate pixel-wise heatmaps, validating the model's focus on pathological regions.

Sensitivity analysis: pixel importance via backprop
1def sensitivity_analysis(model, image, device):
2 image.requires_grad = True
3 output = model(image)
4 output = torch.flatten(output, 1)
5 output.backward()
6 gradient = image.grad.data.squeeze().pow(2).sum(0).sqrt()
7 return gradient.cpu().numpy()
Python
PyTorch
OpenCV
Scikit-Learn
XAI

Decision Trees Optimization & Comparative Benchmarking

Supervised LearningModel SelectionHyper-parameter Tuning
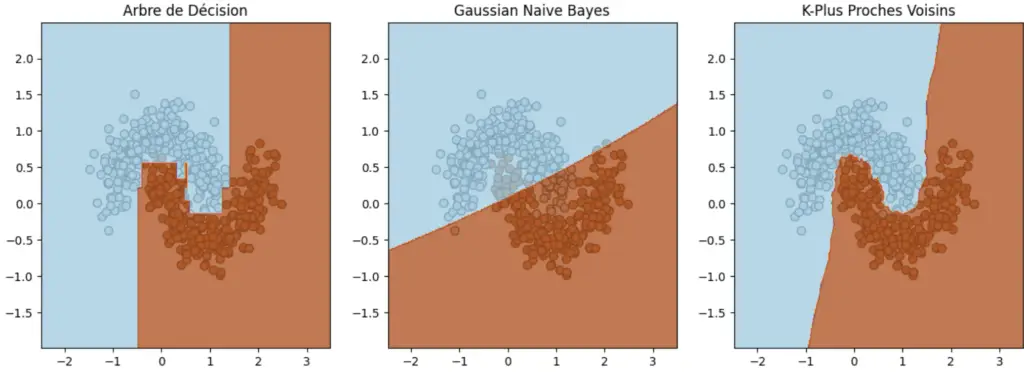
Decision boundaries of a Decision Tree, Gaussian Naive Bayes and k-Nearest Neighbours compared side by side on the same two-moons dataset
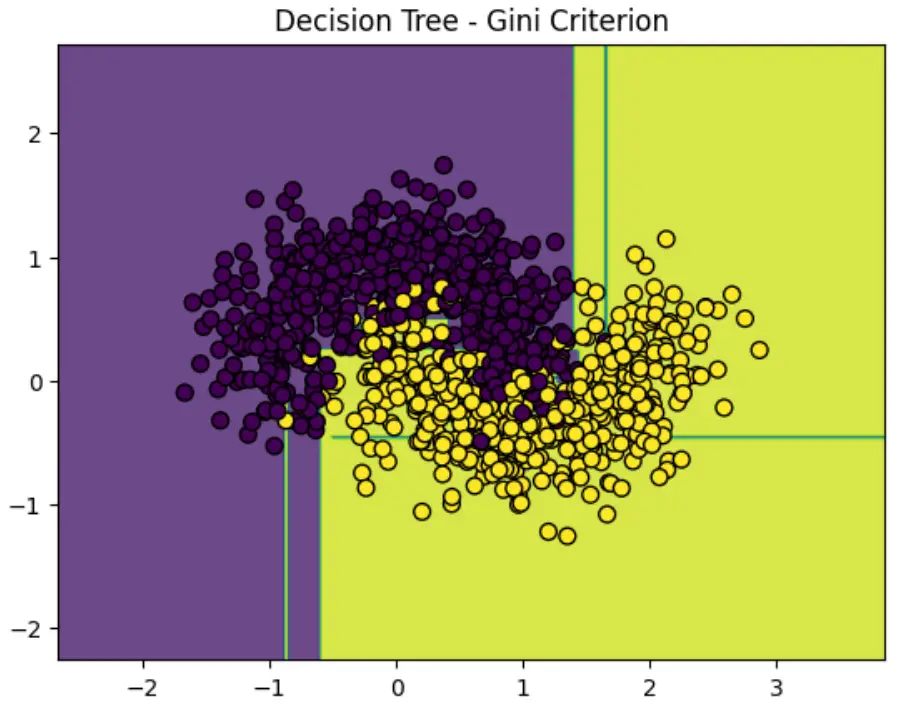
Decision Tree trained with the Gini criterion, showing its axis-aligned decision boundary over the two-class scatter
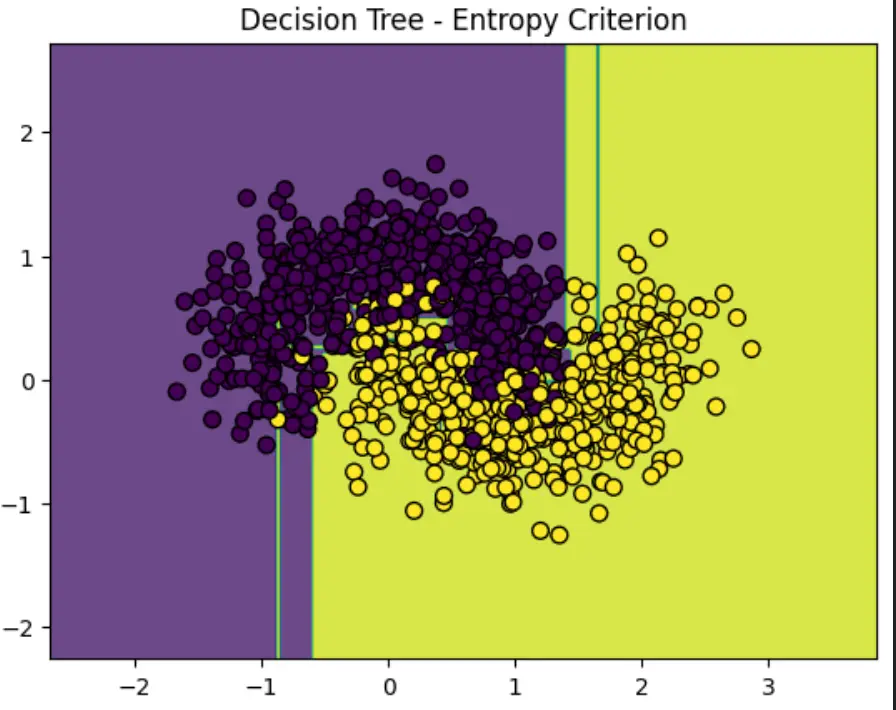
Decision Tree trained with the entropy criterion, showing how the split geometry changes against the Gini version

An in-depth exploration of Decision Tree Classifiers, evaluating their performance against Gaussian Naive Bayes and KNN. The study utilizes the Iris and Make_Moons datasets to visualize complex decision boundaries and conducts a rigorous hyper-parameter sweep to mitigate overfitting through depth and leaf-size constraints.

Python
Scikit-Learn
K-Fold CV
Graphviz
Matplotlib

Statistical ML Multi-Classifier Benchmarking

Statistical LearningPattern RecognitionDecision Theory
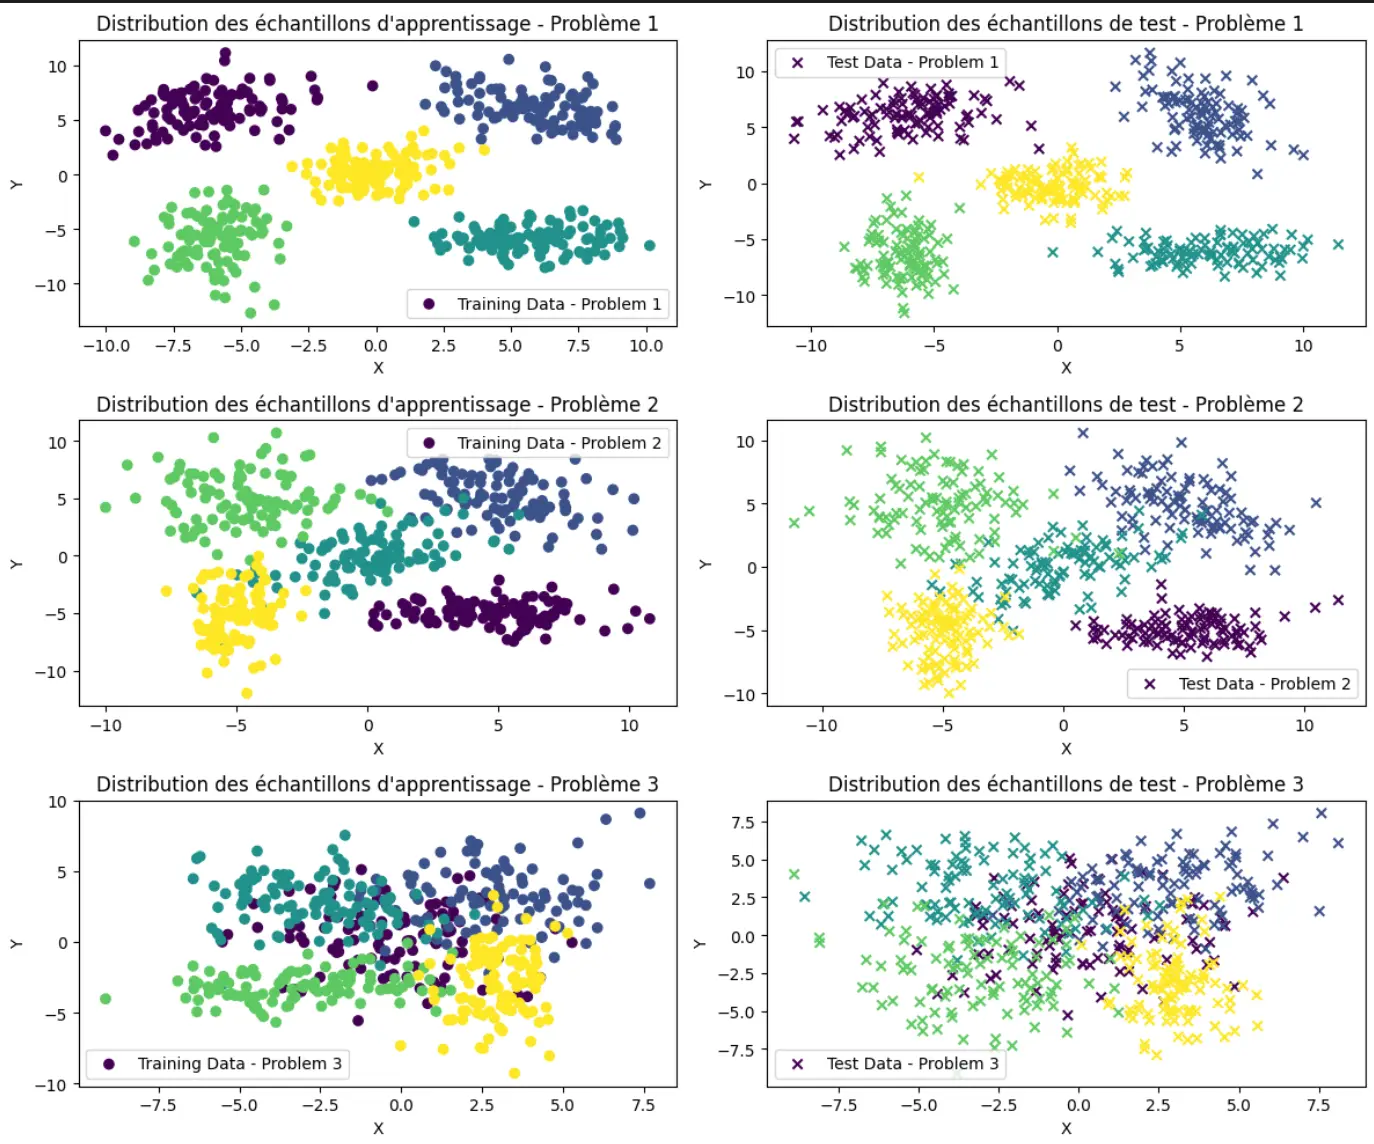
Training and test sample distributions for the three benchmark problems, six scatter panels showing how separable each class set is
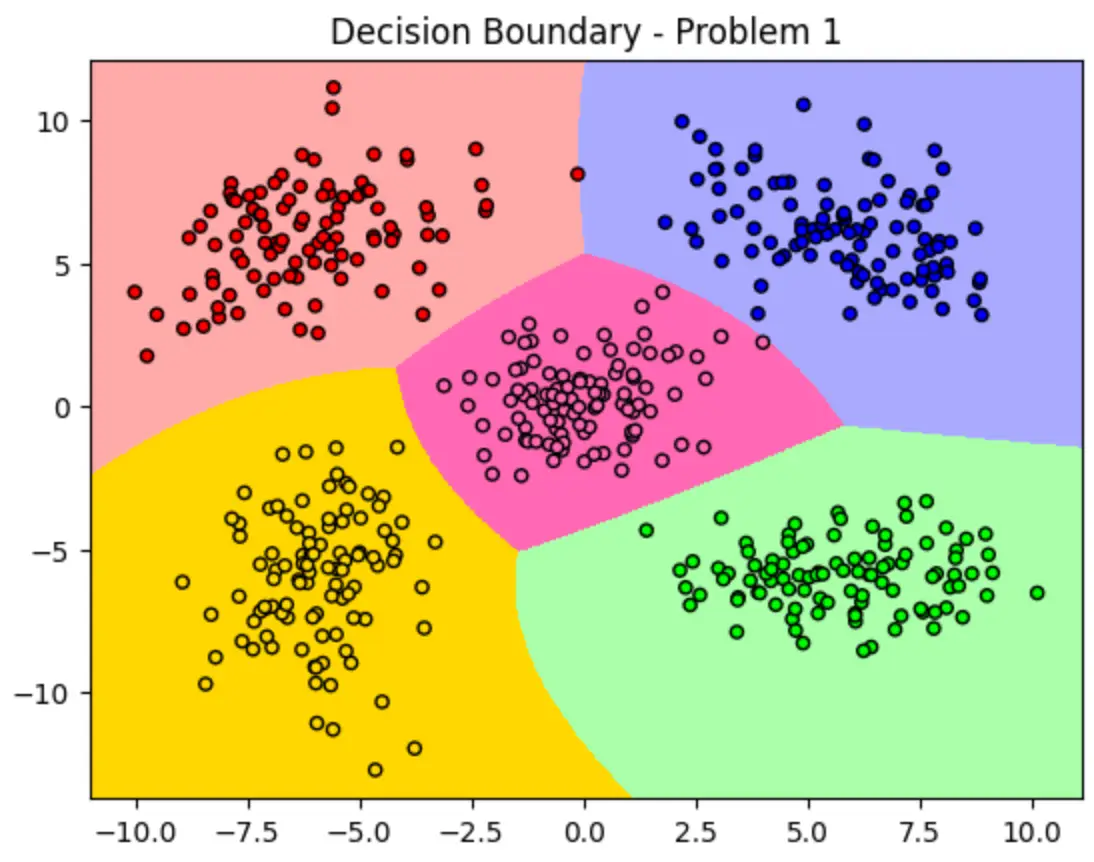
Multi-class decision boundary over problem 1, five well-separated Gaussian clusters each claiming its own coloured region
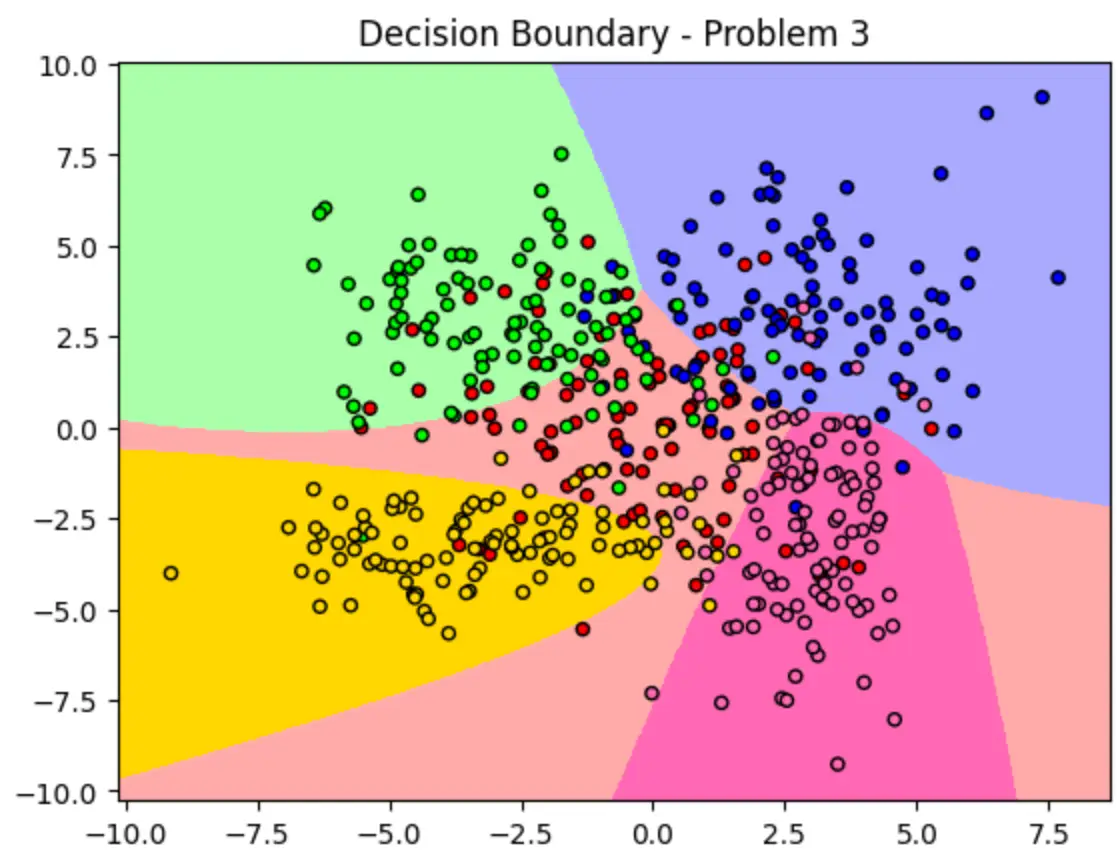
Multi-class decision boundary over problem 3, where overlapping clusters force far more tangled regions
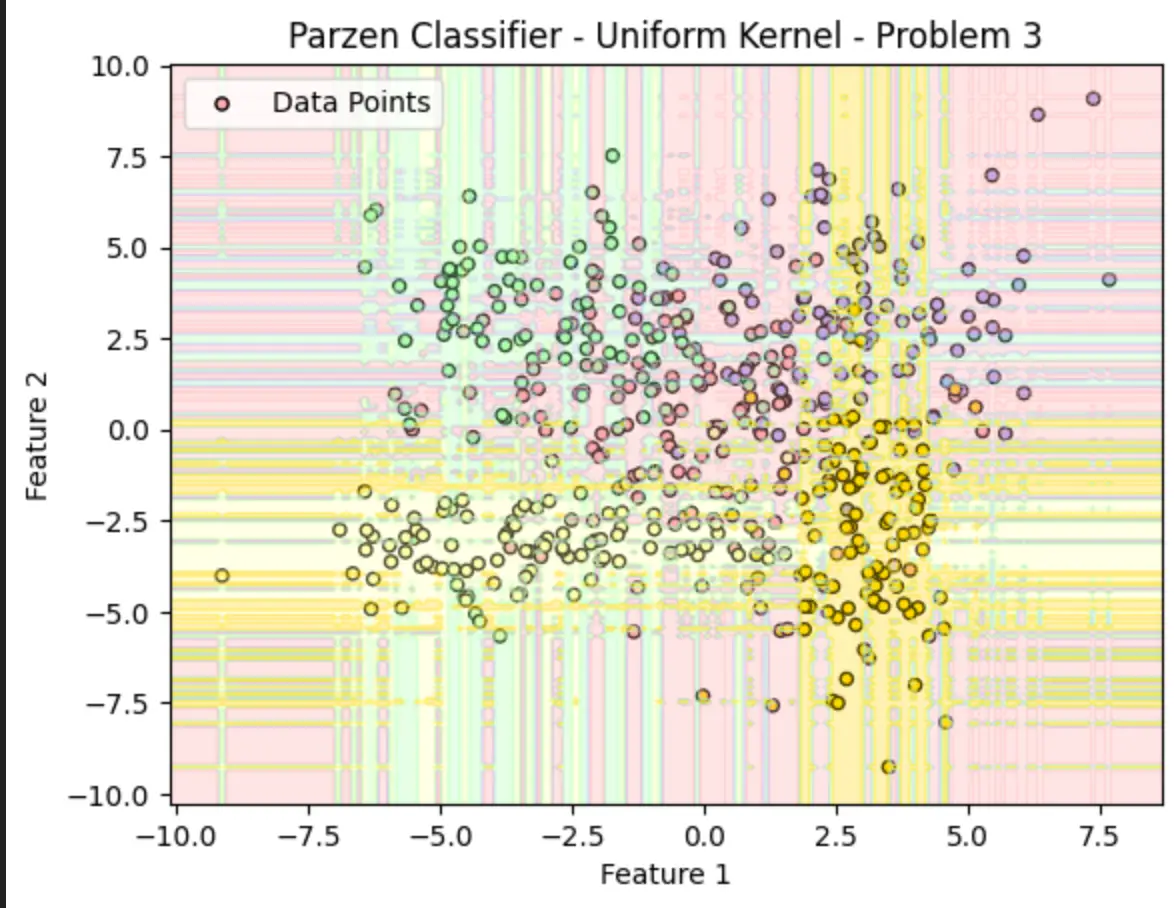
Parzen window classifier with a uniform kernel on problem 3, its density-driven regions fragmenting across the feature plane
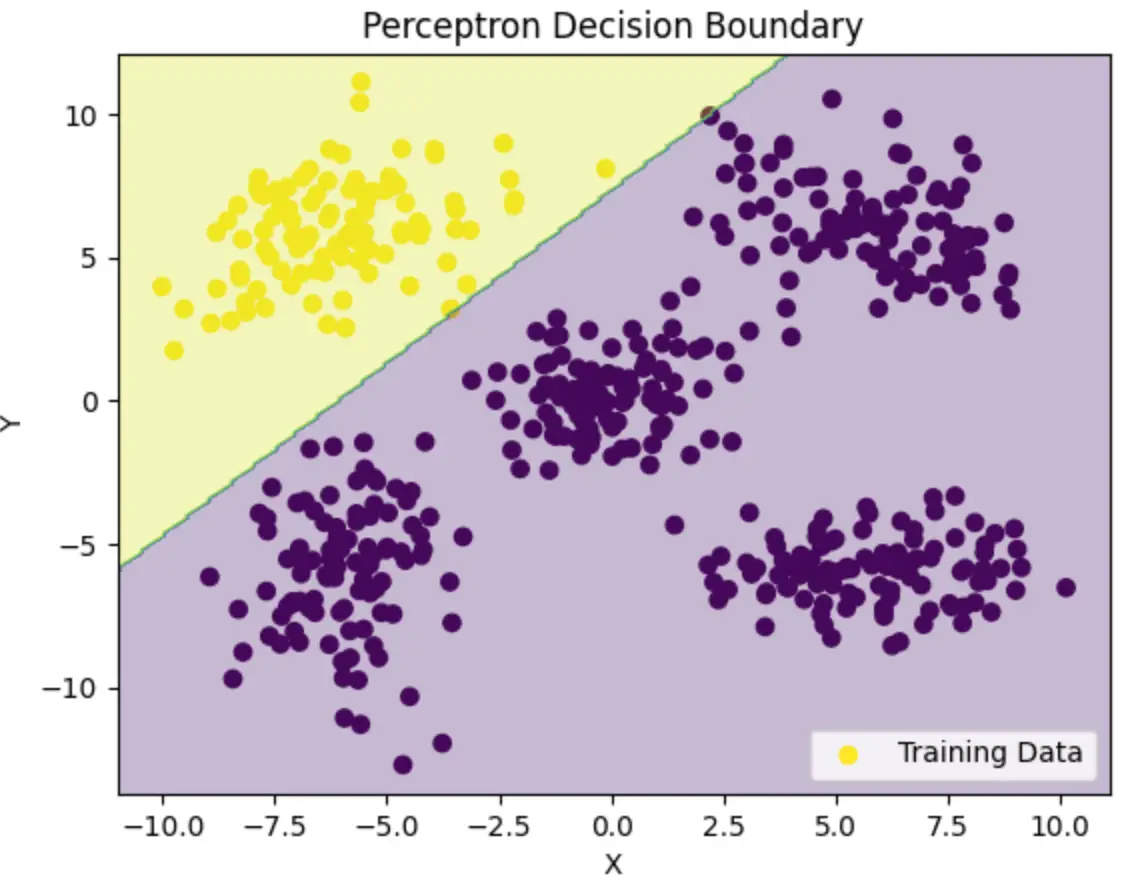
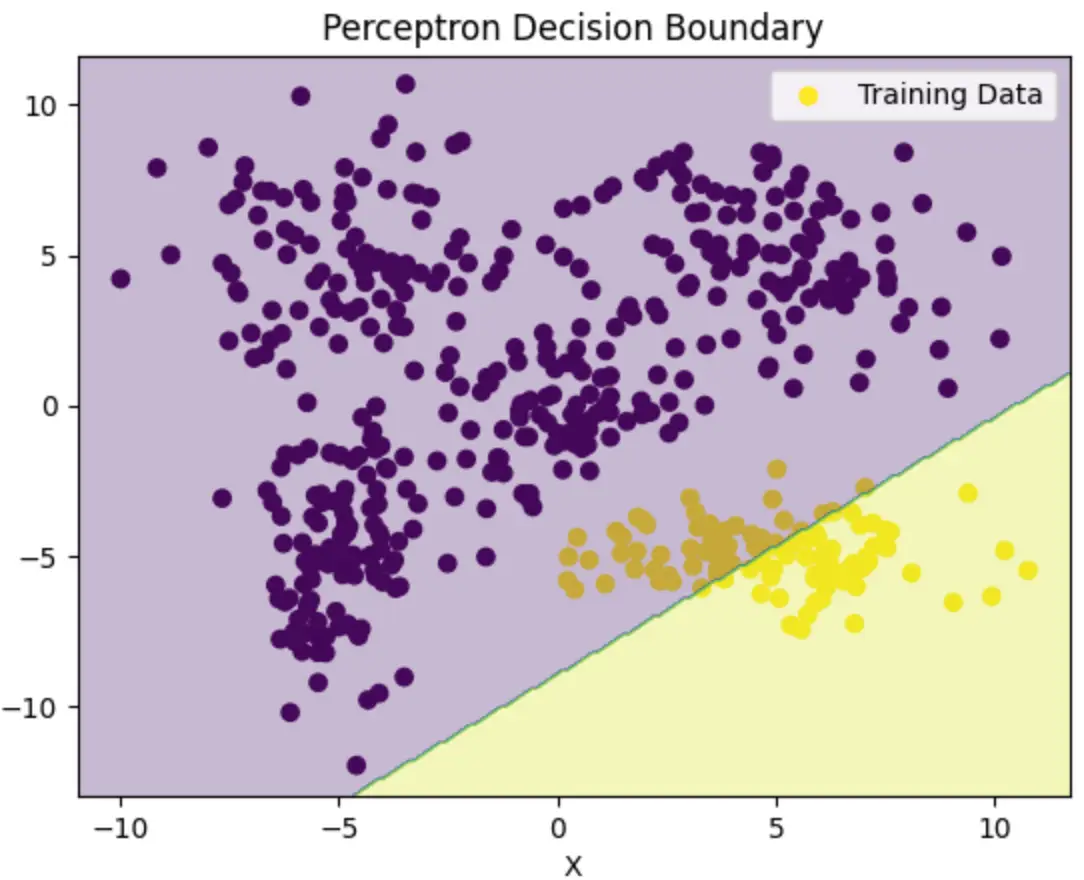
Perceptron decision boundary separating one class from the remaining four with a single straight line
Perceptron decision boundary for a second one-versus-rest split, the linear cut isolating the lower-right cluster
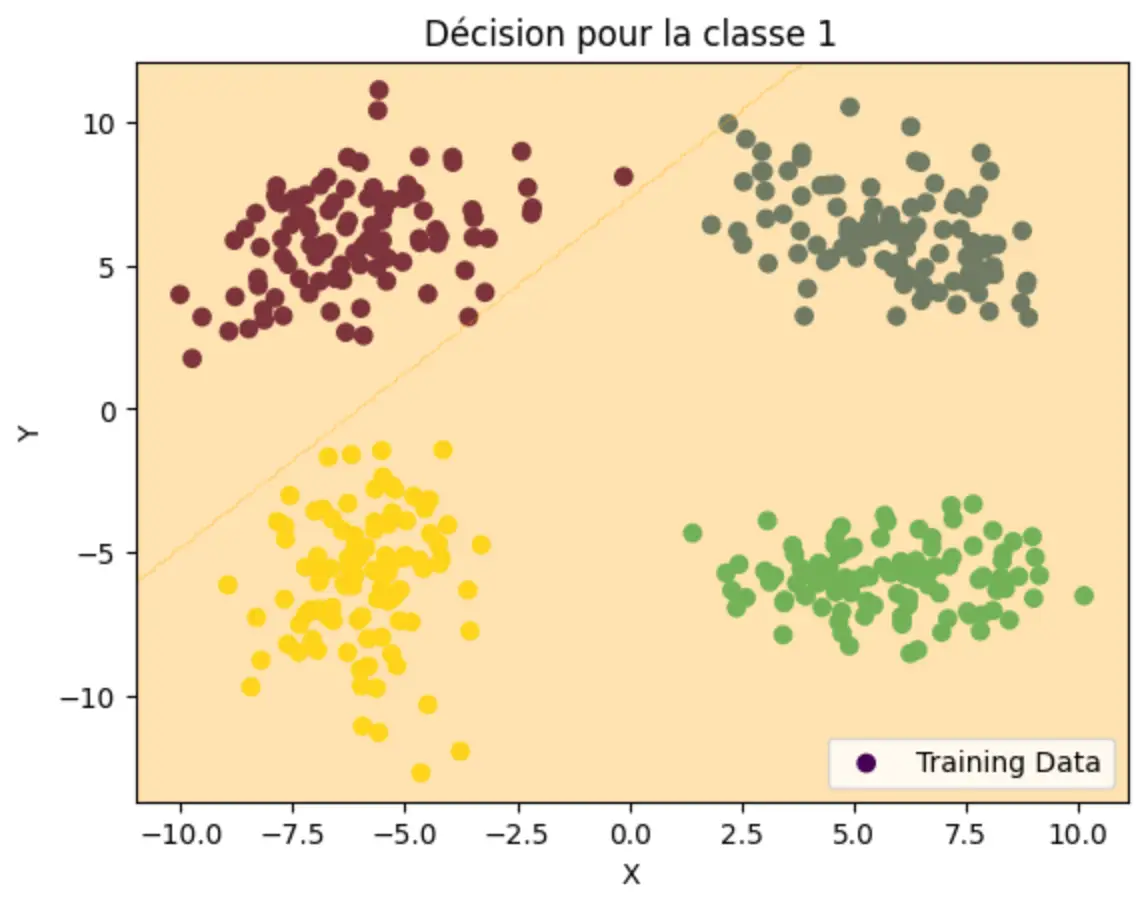
One-versus-rest decision region for class 1 in the multi-class benchmark
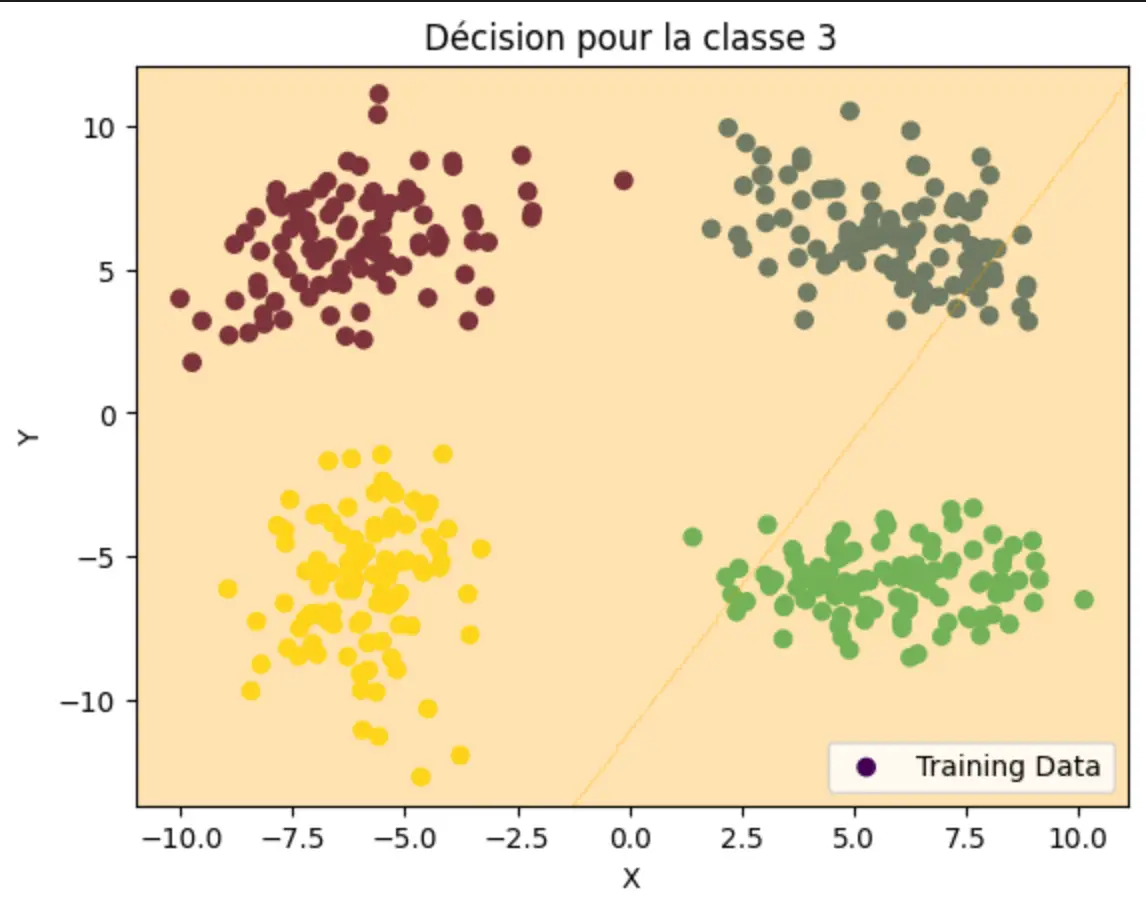
One-versus-rest decision region for class 3 in the multi-class benchmark
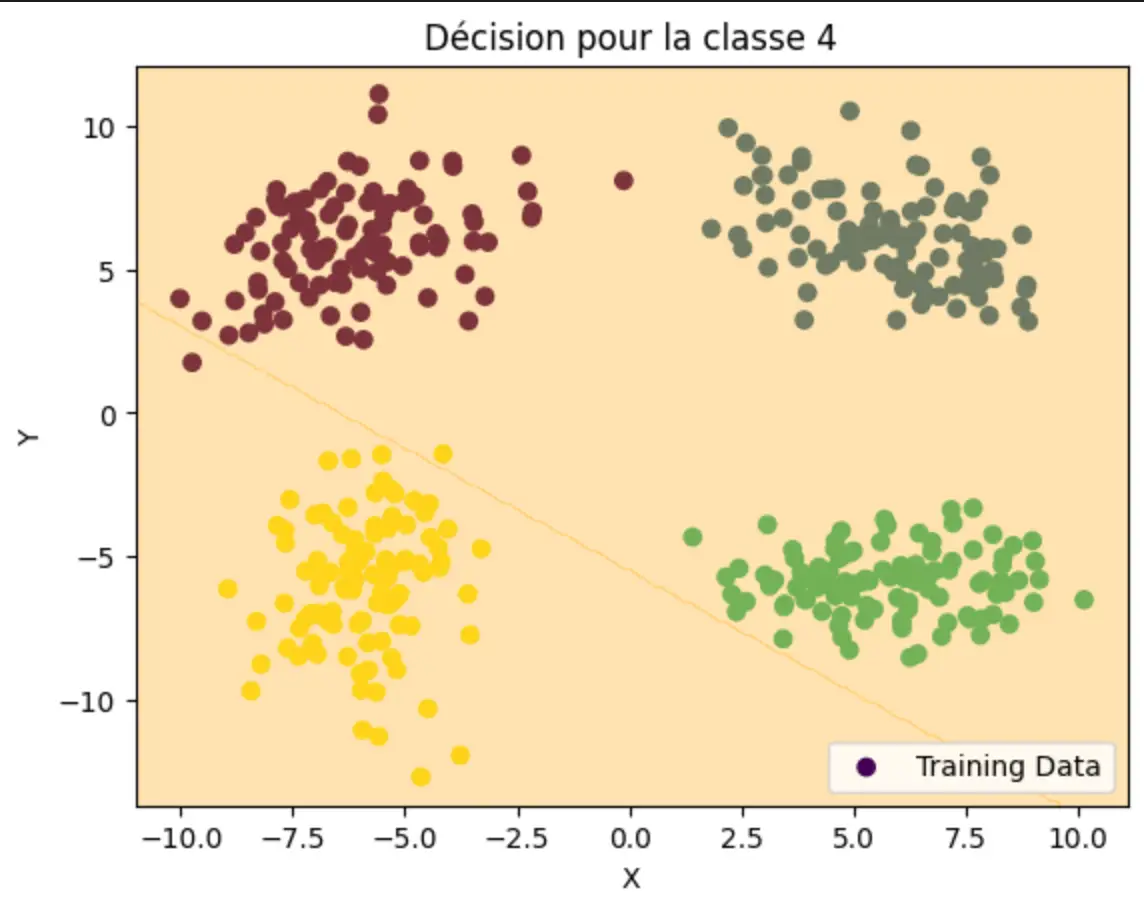
One-versus-rest decision region for class 4 in the multi-class benchmark
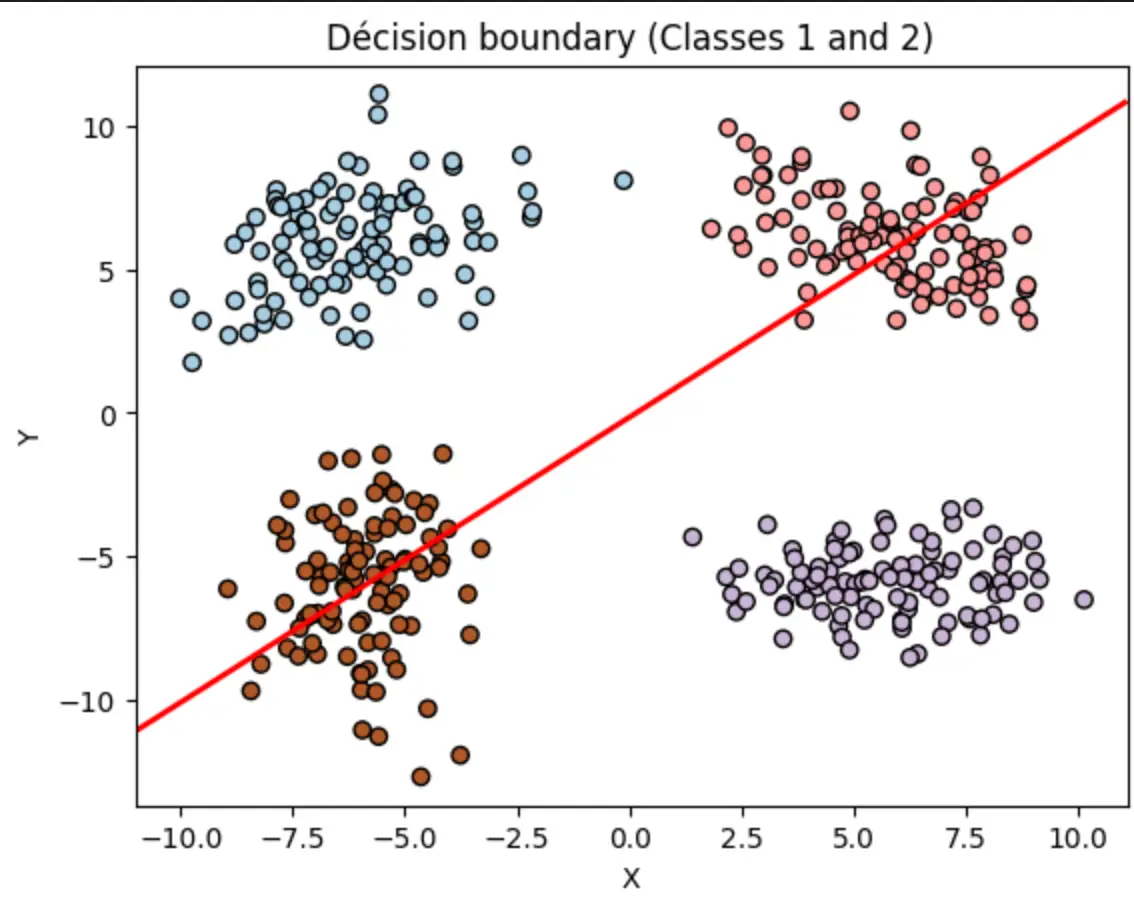
Linear decision boundary separating class 1 from class 2
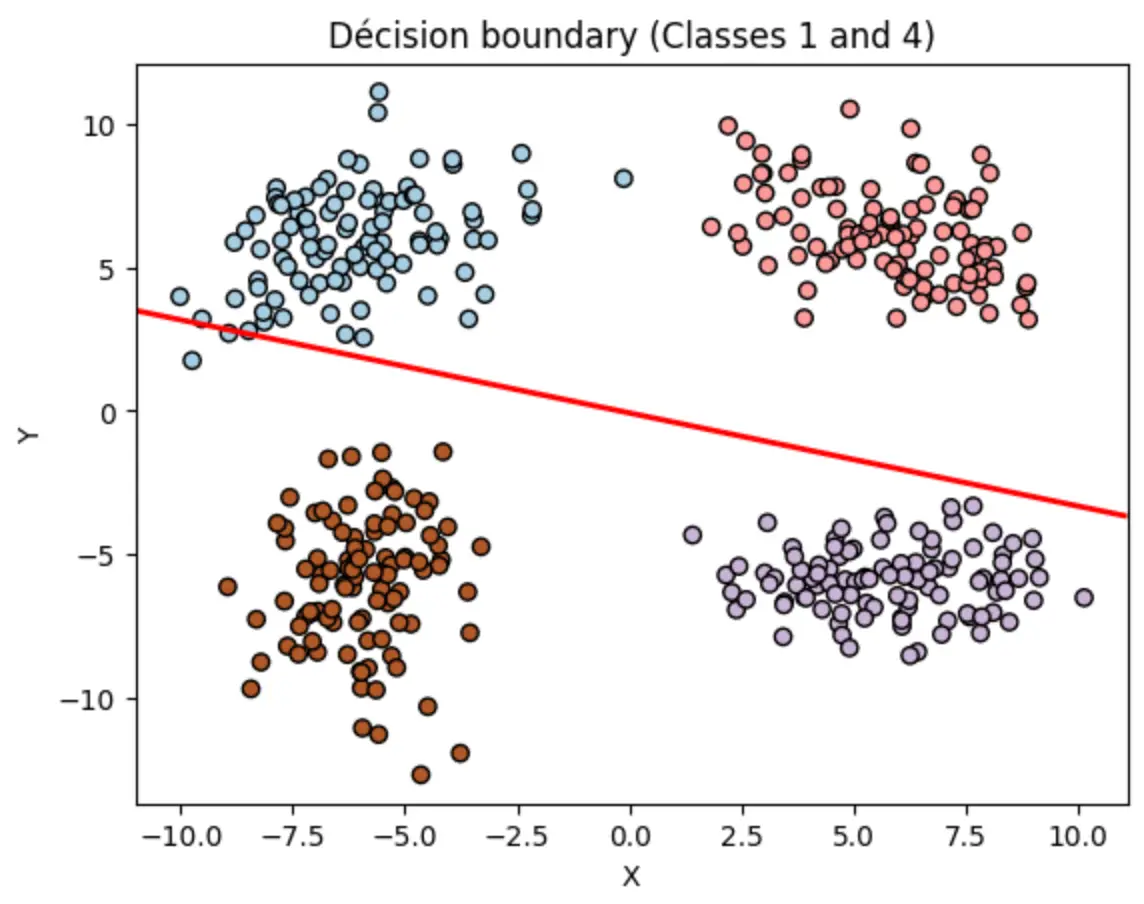
Linear decision boundary separating class 1 from class 4
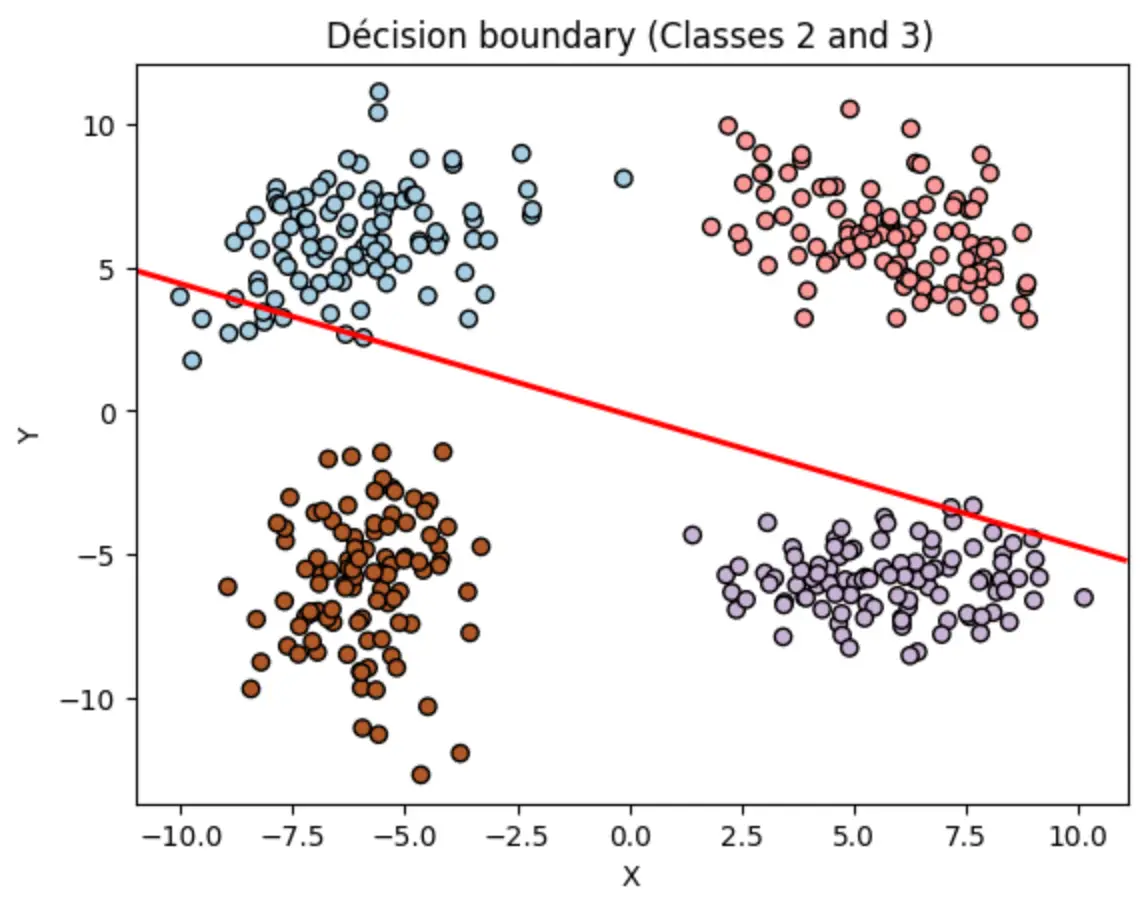
Linear decision boundary separating class 2 from class 3
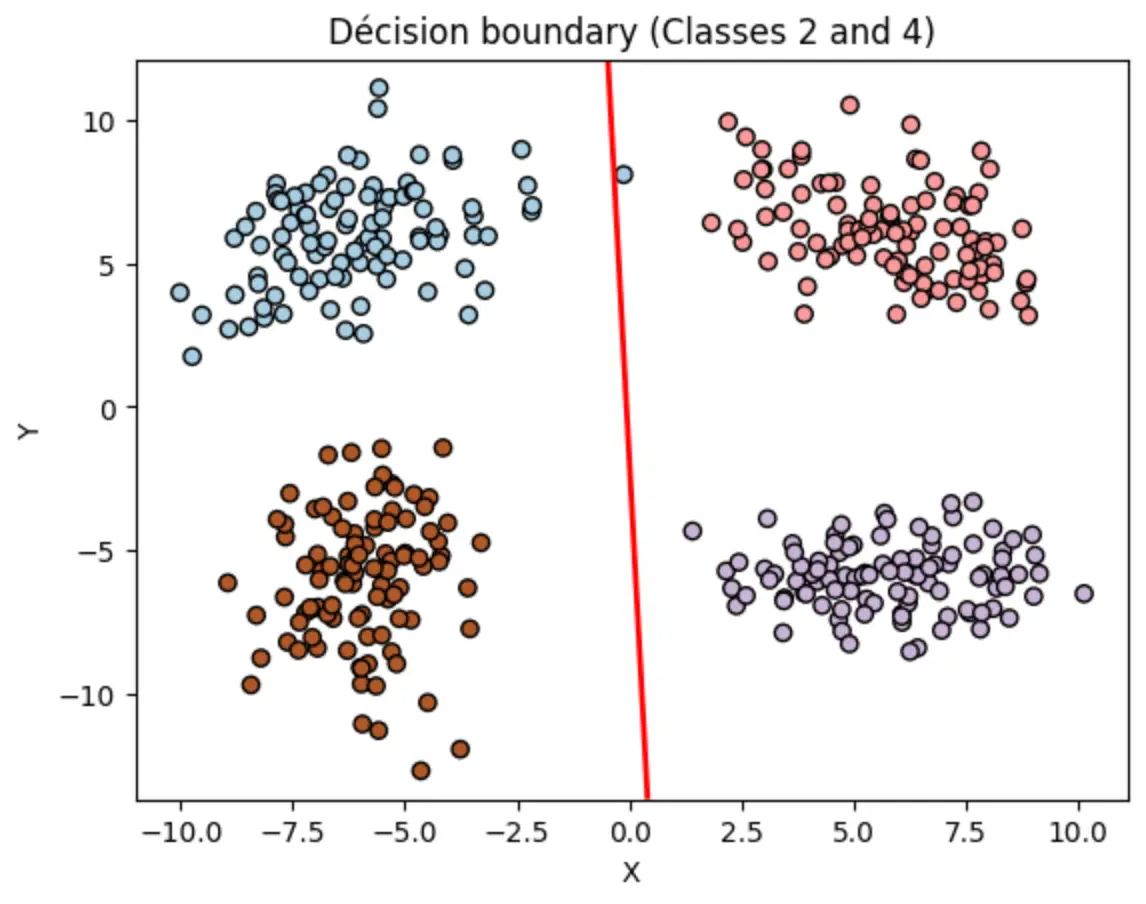
Linear decision boundary separating class 2 from class 4
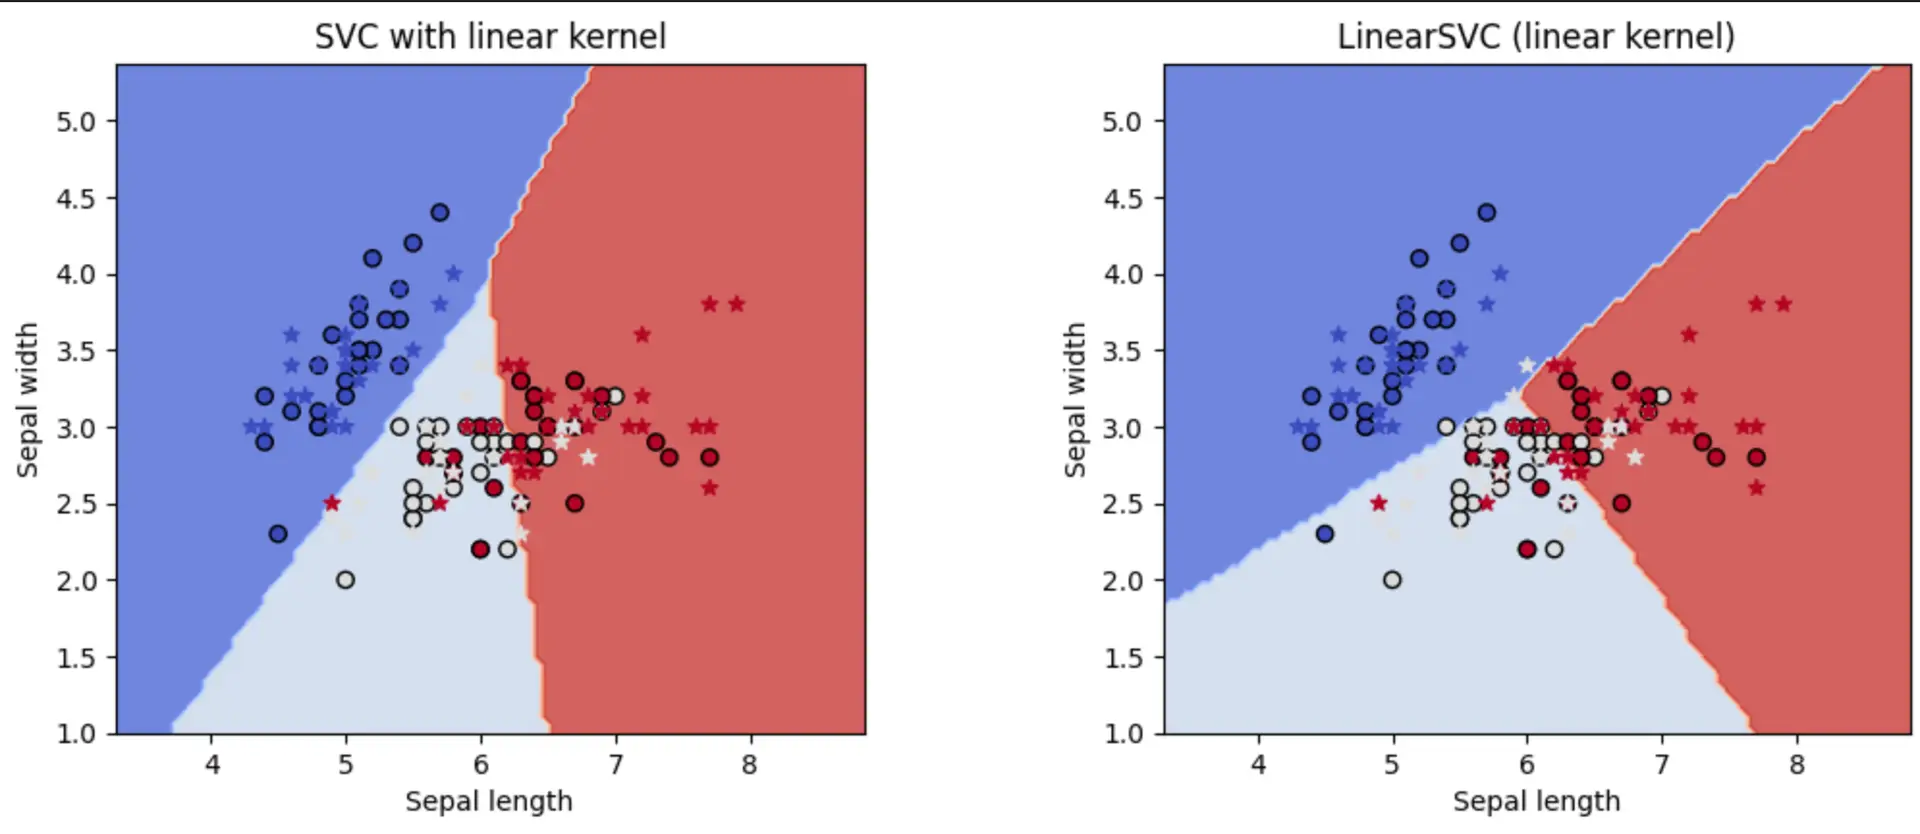
SVC with a linear kernel compared against LinearSVC on the Iris dataset, plotted over sepal length and sepal width
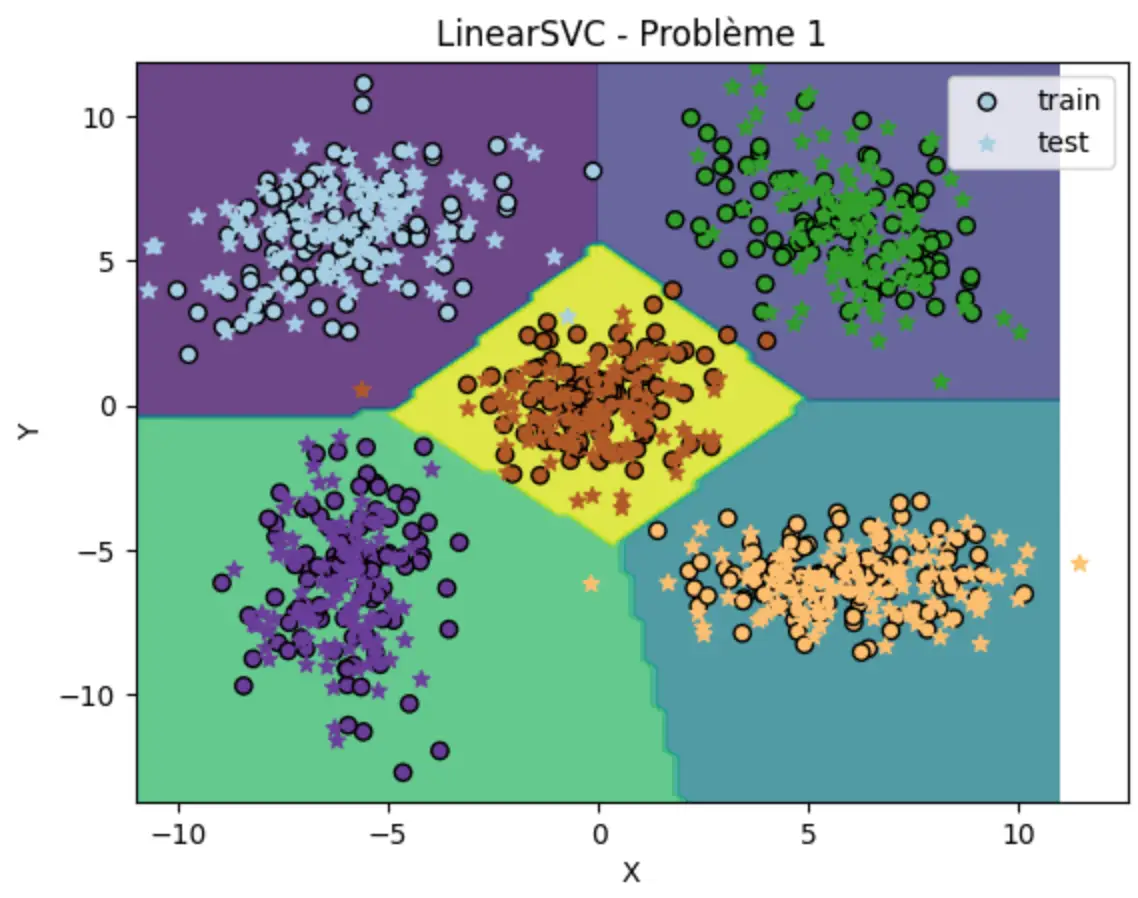
LinearSVC decision regions on problem 1, with training points as circles and test points as stars
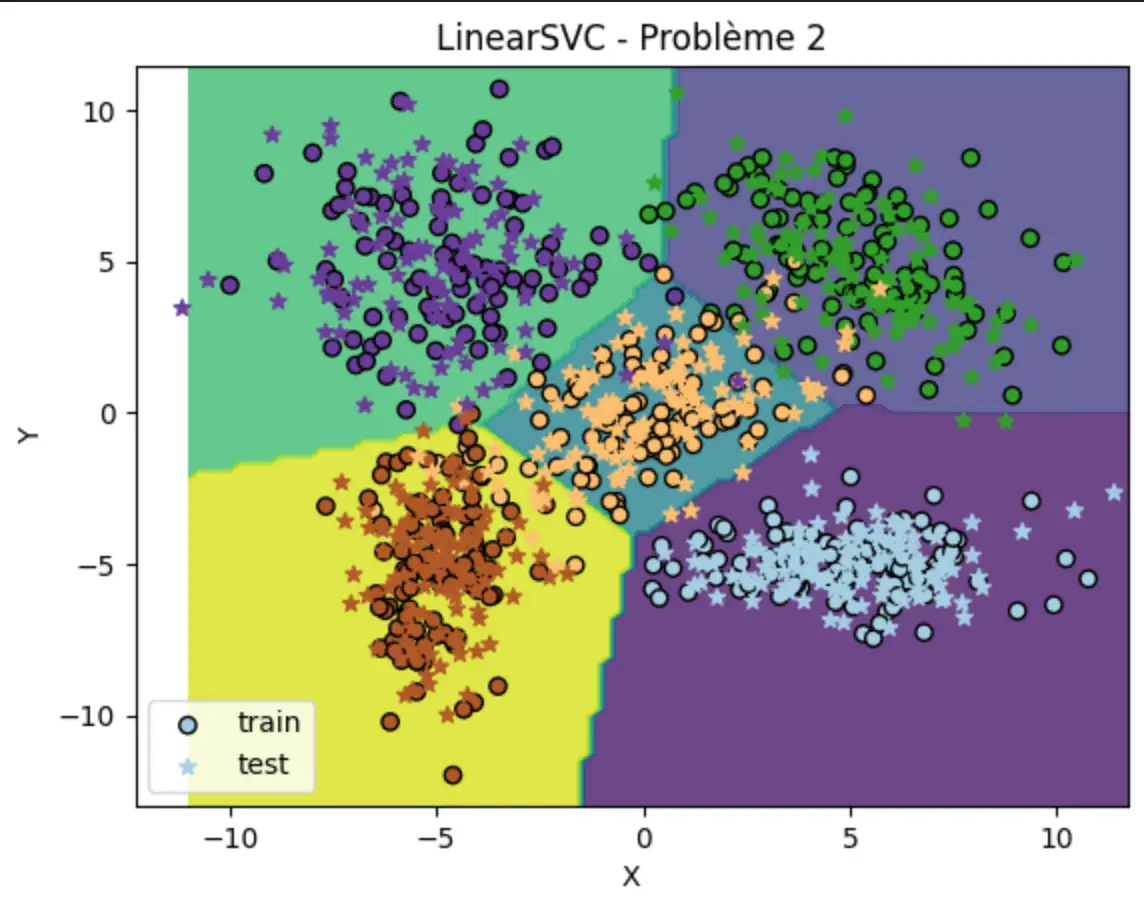
LinearSVC decision regions on problem 2, where the classes begin to overlap
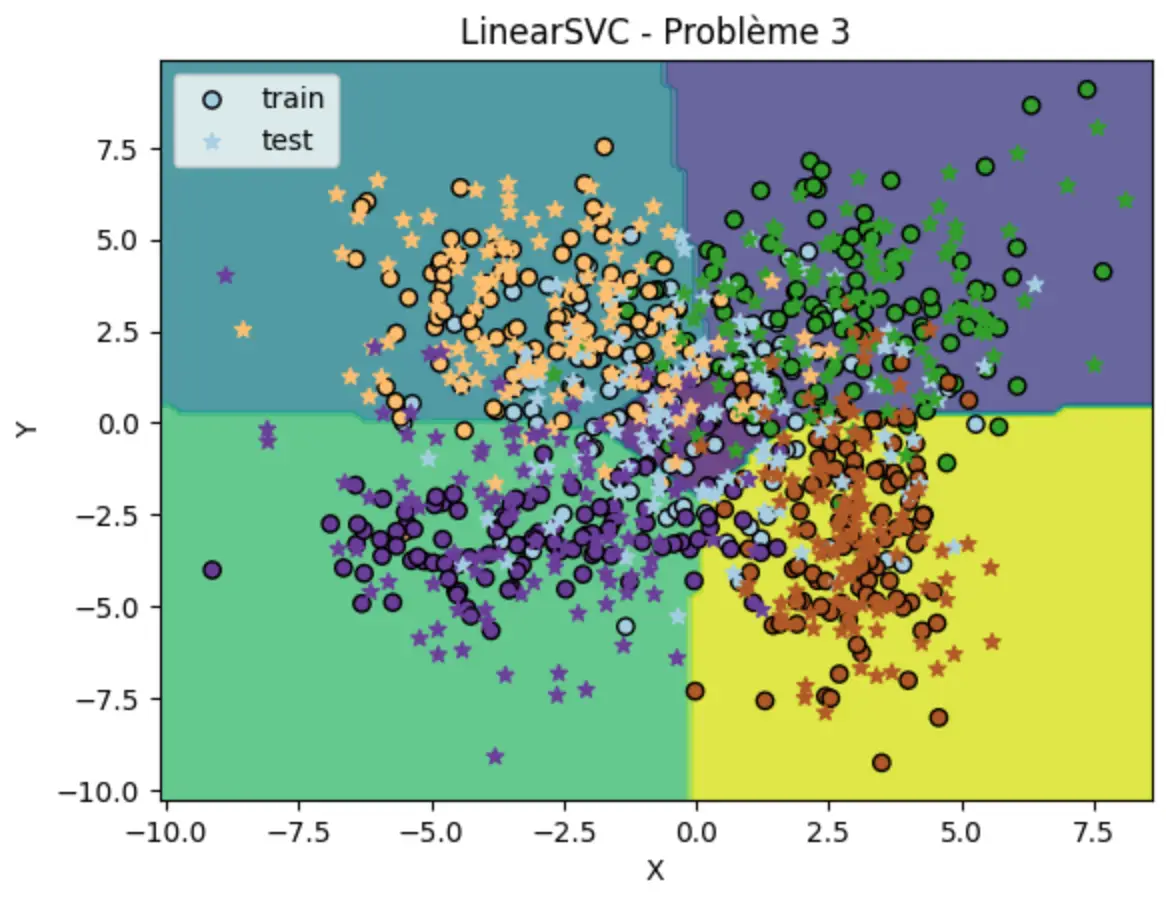
LinearSVC decision regions on problem 3, the hardest of the three benchmarks

A comparative study of five fundamental classification algorithms: Minimum Euclidean Distance, Mahalanobis Distance, k-NN (Majority/Unanimity), and Parzen Windows. The project involves mathematical modeling of decision boundaries and performance optimization using 5-Fold Cross-Validation to determine hyper-parameters.

Mahalanobis distance
1# Distance relative to class covariance
2def mahalanobis_distance(self, x, class_label):
3 mu = self.mean_vectors[class_label]
4 inv_cov = np.linalg.inv(self.covariance_matrices[class_label])
5 delta = x - mu
6 return np.sqrt(delta @ inv_cov @ delta.T)
Python
NumPy
Scikit-Learn
Seaborn
Matplotlib

Industrial Matrix Variable Importance & Decision Support

Explainable AI (XAI)Industry 5.0Decision Support Systems
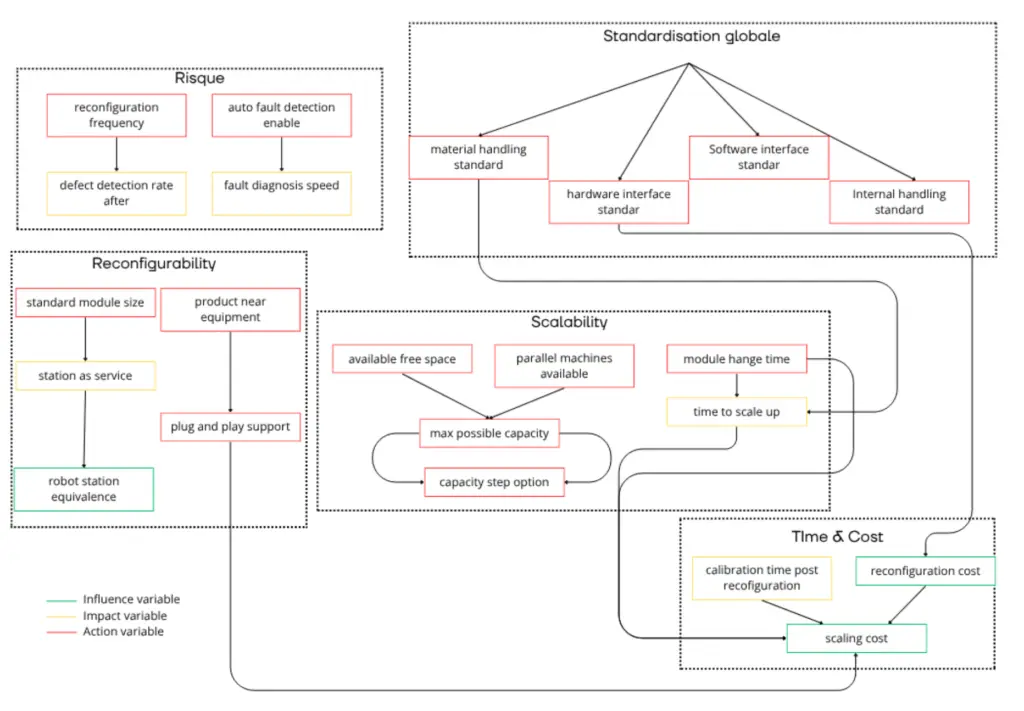
Influence map of the industrial decision matrix, grouping 40+ variables under Risk, Reconfigurability, Scalability, Global Standardisation and Time & Cost, with influence, impact and action variables colour-coded
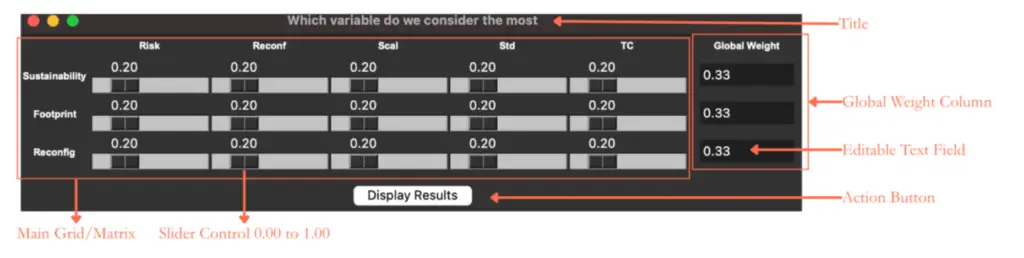
Tkinter decision-support dashboard where Sustainability, Footprint and Reconfigurability are weighted against each criterion with 0.00 to 1.00 sliders and a global weight column

A high-level decision support system developed for ASSAR Industrial Innovation Arena. This project uses Random Forest Regressors and SHAP interpretability to decode the complex relationships between 40+ industrial variables, identifying the primary drivers of Sustainability, Reconfigurability, and Footprint.

SHAP variable importance
1model = RandomForestRegressor(n_estimators=400).fit(X, y)
2explainer = shap.TreeExplainer(model)
3shap_values = explainer.shap_values(X) # 40+ industrial vars
4shap.summary_plot(shap_values, X) # top drivers
Python
SHAP
RFR
Tkinter
Seaborn